


Organizations rely on their assets to drive productivity, profitability and growth. Without measuring how those assets perform, it is hard to get the most from them or to know whether goals are being met. That is the job of key performance indicators (KPIs). This guide explains what asset management KPIs are, why they matter, and the essential KPIs that help organizations improve asset utilization, reduce costs and run more efficiently.
Each KPI below comes with its formula and what it tells you, followed by a worked example, a set of IT asset management KPI examples, and the steps to put the measures on a dashboard your team will actually read.
Understanding Key Performance Indicators (KPIs)
In asset management, key performance indicators (KPIs) are measurable figures that show the performance, condition, cost and use of assets over time. Each one is compared with a target or a previous period, so a team can see where it is improving, where it is slipping and what to act on first.
A KPI is different from a plain metric. A metric is any number you can count, such as the number of work orders closed this month. A KPI is a metric you have chosen because it is tied to a goal, such as keeping a production line available 98% of the time, and it has a target and an owner.
Good asset management KPIs share four traits:
- Defined. Everyone calculates them the same way, from the same records.
- Owned. One person answers for each one.
- Targeted. Each has a target or a range, so a number means something.
- Actionable. A change in the figure points to something the team can do.
Essential KPIs for Effective Asset Management
The table gives the most widely used asset management KPIs and asset performance metrics, with the formula for each. Pick the five or six that match your goals rather than tracking all of them.
| KPI | Formula | What it tells you |
|---|---|---|
| Asset utilization rate | Hours in use ÷ hours available × 100 | Which assets are idle and could be moved, shared or sold |
| Mean time between failures (MTBF) | Total operating time ÷ number of failures | How reliable a repairable asset is |
| Mean time to repair (MTTR) | Total repair time ÷ number of repairs | How quickly the team restores an asset after a failure |
| Availability | Uptime ÷ (uptime + downtime) × 100 | The share of time an asset could run when needed |
| Planned maintenance percentage (PMP) | Planned maintenance hours ÷ total maintenance hours × 100 | How much maintenance is planned rather than reactive |
| PM compliance | Preventive work done on time ÷ preventive work due × 100 | Whether the maintenance schedule is being kept |
| Maintenance backlog | Open work hours ÷ weekly crew hours available | How many weeks of work are waiting |
| Maintenance cost as % of replacement asset value | Annual maintenance cost ÷ replacement asset value × 100 | Whether maintenance spending is in proportion to what the assets are worth |
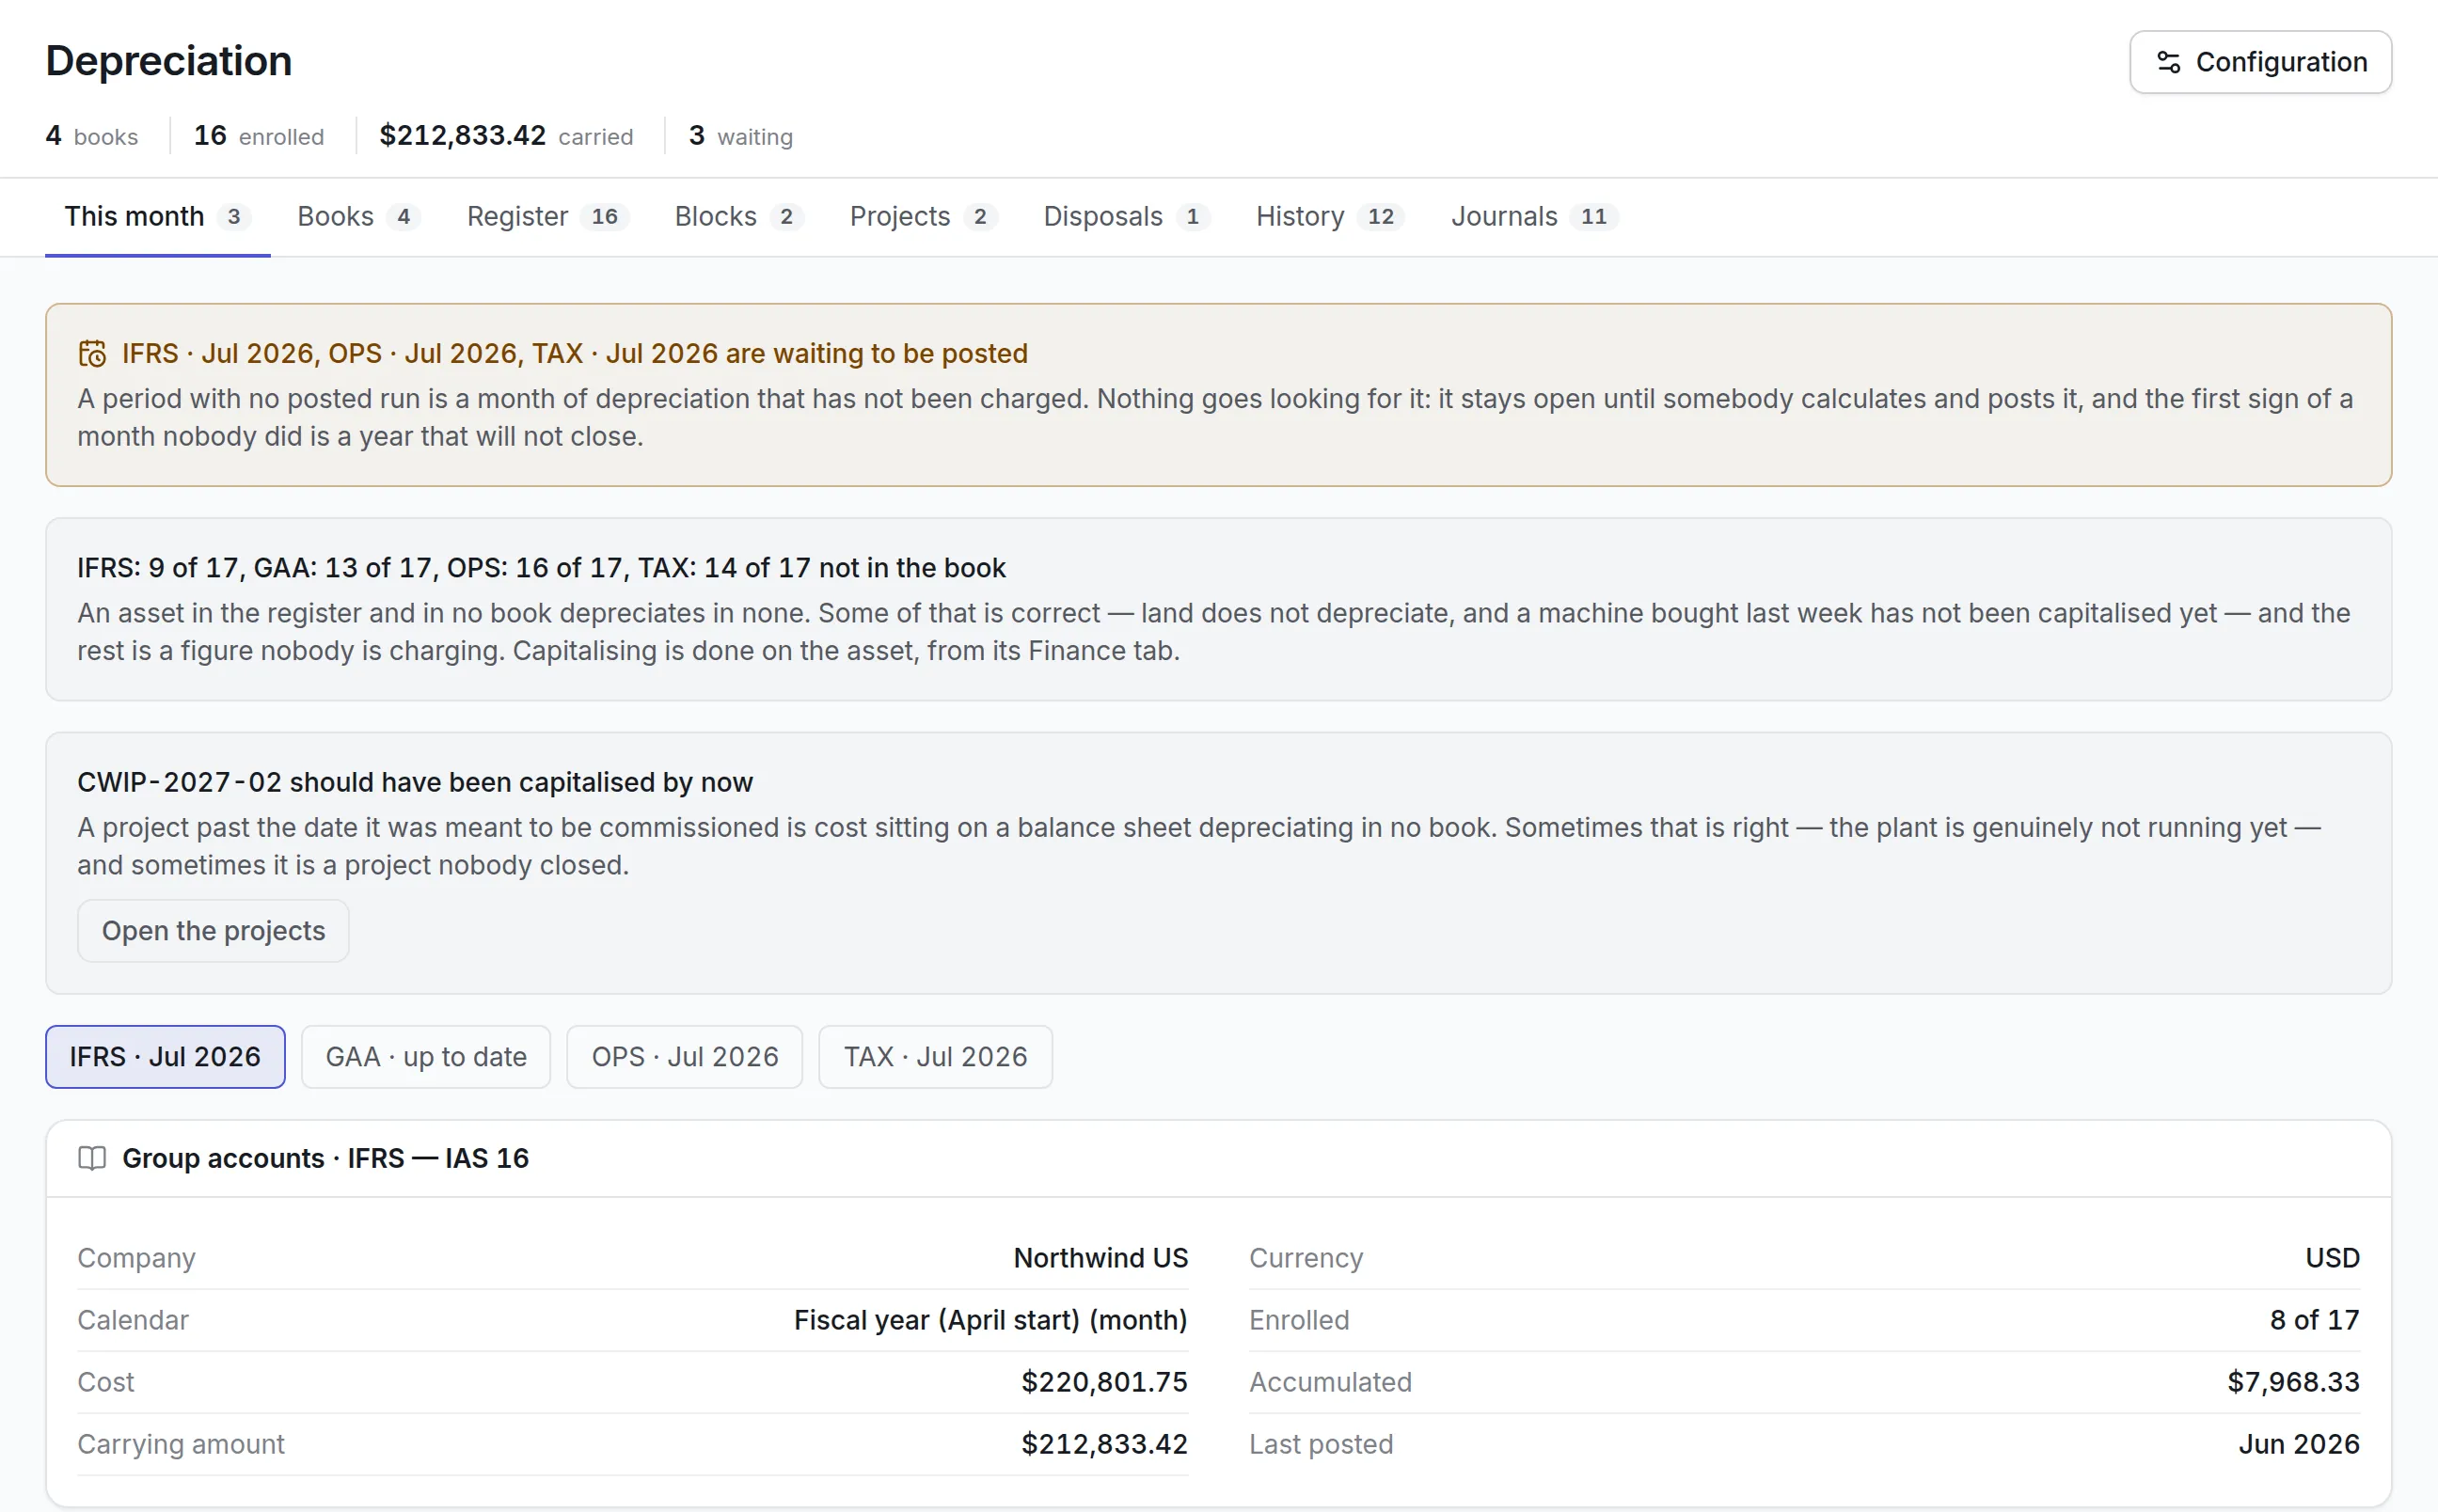
| Asset lifecycle cost | Acquisition + operation + maintenance + disposal cost | The full cost of owning an asset, for repair-or-replace decisions |
| Return on assets (ROA) | Net income ÷ average total assets × 100 | How well the business turns its assets into profit |
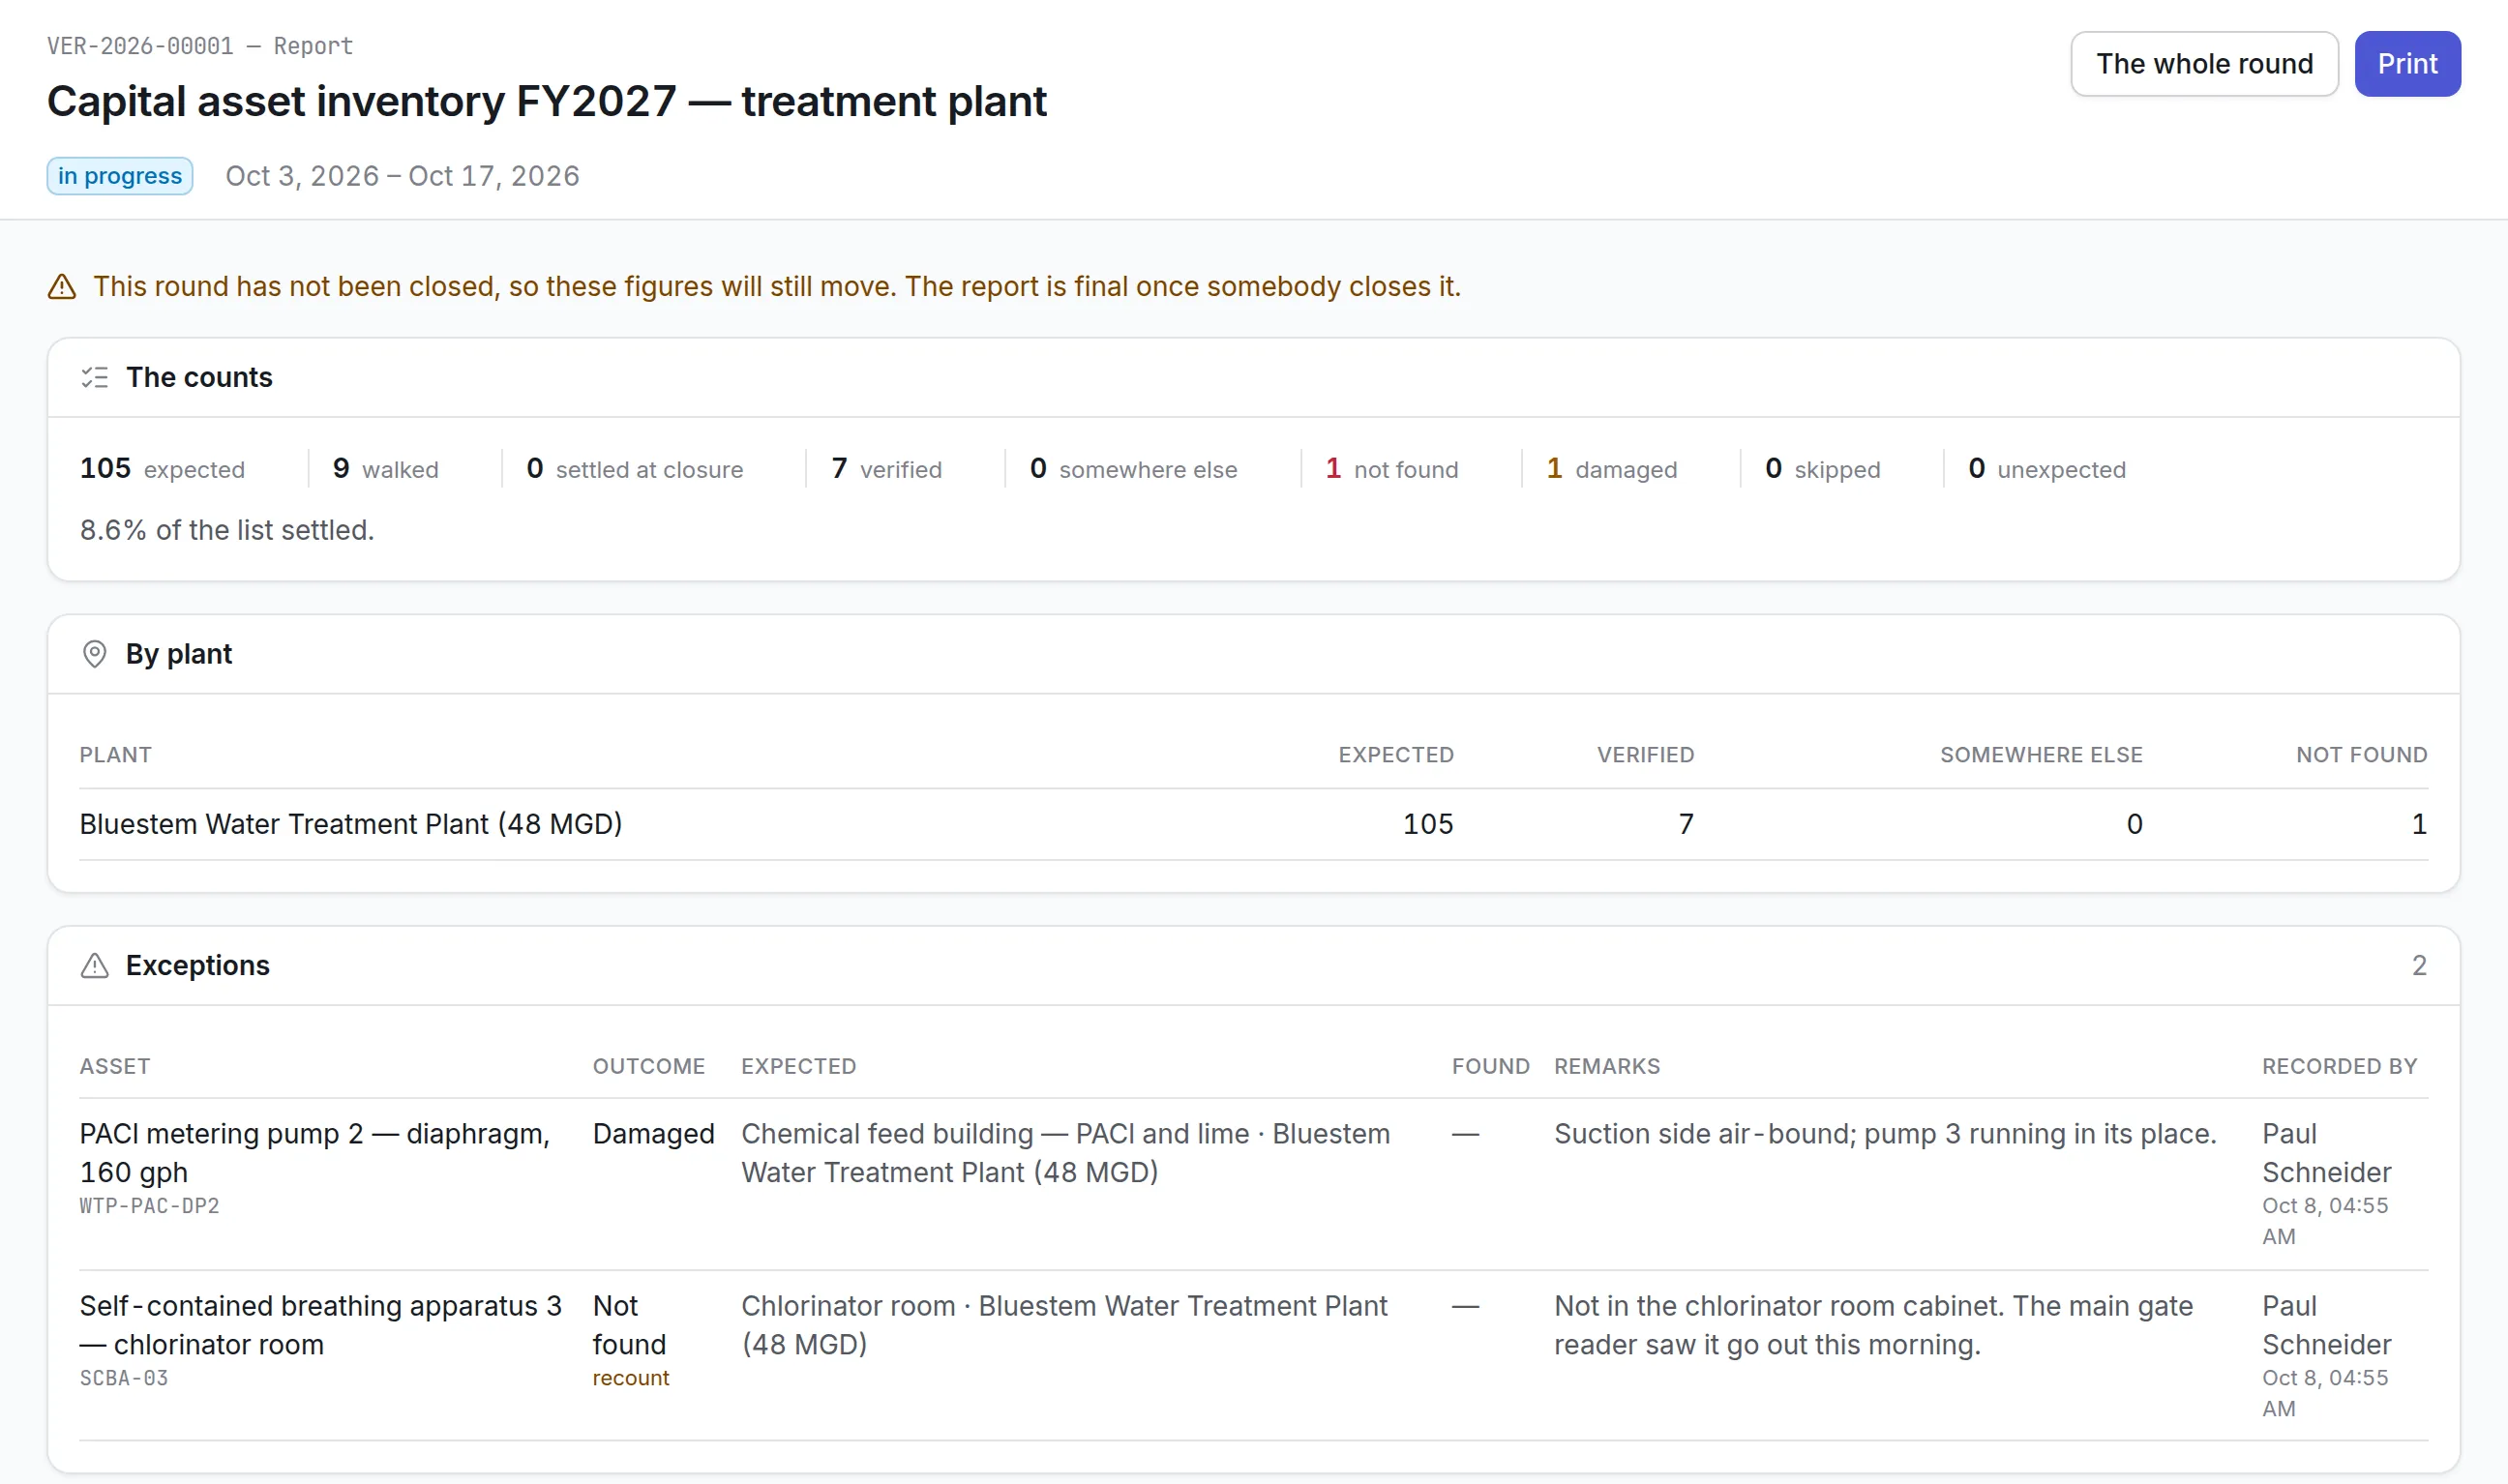
| Asset register accuracy | Assets verified as recorded ÷ assets checked × 100 | Whether the register matches what is on the floor |
| Energy use per unit of output | Energy consumed ÷ units produced | Which assets use more energy than they should |
Asset Utilization Rate
Utilization measures the share of available time an asset is actually used. Low utilization points to equipment that could be moved to another site, shared or sold before more is bought. Read more on how to optimize asset utilization.
Mean Time Between Failures (MTBF)
MTBF is the average operating time between one failure and the next for a repairable asset. A rising MTBF means the asset is getting more reliable. It needs at least two failures before it says anything useful.
Mean Time to Repair (MTTR)
MTTR is the average time from failure to the asset running again, including diagnosis, waiting for parts and testing. A high MTTR often points to missing spares or slow response rather than slow repairs.
Planned Maintenance Percentage (PMP)
PMP is the share of maintenance hours that were planned. Many maintenance teams treat a high PMP as a sign of a mature program, because planned work is cheaper and safer than emergency repairs.
Asset Lifecycle Cost
Lifecycle cost adds up everything an asset costs across its life cycle: purchase, installation, running, maintenance and disposal. It supports the decision to repair, replace or retire.
Mean Time to Failure (MTTF)
MTTF is the average time a non-repairable item, such as a bearing, filter or lamp, runs before it fails. Use it to plan replacement intervals and spare part stock.
Return on Assets (ROA)
ROA is a financial ratio: net income divided by average total assets. It shows how much profit the business earns for each dollar tied up in assets, and is usually reported by finance.
Compliance Rate
Compliance rate is the share of assets whose required inspections, certifications and statutory checks are current. A lapsed pressure vessel inspection or calibration certificate shows up here before an auditor finds it.
Customer Satisfaction
For facilities and service teams, satisfaction with how fast requests are handled is a KPI in its own right. SLA compliance, the share of requests answered and resolved within their promised time, is the measurable form of it.
A Worked Example: One Pump, Four KPIs
A cooling water pump was scheduled to run 4,000 hours last year. It failed four times, and the four repairs took 32 hours in total.
| KPI | Calculation | Result |
|---|---|---|
| MTBF | 4,000 hours ÷ 4 failures | 1,000 hours |
| MTTR | 32 hours ÷ 4 repairs | 8 hours |
| Availability | 4,000 ÷ (4,000 + 32) × 100 | 99.2% |
| PMP | 120 planned hours ÷ 152 total maintenance hours × 100 | 78.9% |
Read together, the figures say more than any one of them. An MTTR of 8 hours on a simple pump suggests repairs are waiting on something, often parts. Four failures in a year on an asset with 120 hours of planned maintenance is worth a root cause investigation.
IT Asset Management KPI Examples
IT asset management uses its own metrics, because laptops and software licenses rarely “fail” in the way a pump does. These are the IT asset management metrics most teams start with:
| IT asset management KPI | Formula | Why it matters |
|---|---|---|
| Inventory accuracy | Devices found as recorded ÷ devices checked × 100 | An inaccurate inventory hides lost and unmanaged devices |
| Discovery coverage | Devices reporting through discovery ÷ devices in the inventory × 100 | Devices that stop checking in may be lost, stolen or unpatched |
| License compliance | Installations covered by a license ÷ total installations × 100 | Shortfalls are an audit risk |
| License utilization | Licenses in use ÷ licenses owned × 100 | Unused licenses are money spent for nothing |
| Hardware age | Devices past their planned refresh age ÷ total devices × 100 | Old devices fail more and slow people down |
| Warranty coverage | Devices under warranty ÷ total devices × 100 | Repairs outside warranty cost more |
| Leaver recovery rate | Devices recovered from leavers ÷ devices assigned to leavers × 100 | Devices not returned are a cost and a data risk |
| Unauthorized software | Devices with blocked software installed | Unapproved software is a security risk |
The IT asset management guide covers how to build the inventory these figures come from.
How to Set Up Asset Management KPIs
- Start from goals. Write down what the business needs from its assets this year, such as less downtime on line 2 or lower spend on software.
- Choose five or six KPIs. Pick the measures that show progress toward those goals. More than that and nobody reads them.
- Define each one precisely. Agree the formula, the data source and what counts as a failure, a repair or a planned job.
- Record the data at the source. KPIs are only as good as the work orders, meter readings and counts behind them.
- Set a baseline and a target. Measure three to six months before setting targets, so they are realistic.
- Put them on a dashboard. Show each KPI against its target, with the trend, where the owner sees it every week.
- Review and act. A KPI that nobody discusses in a meeting is not doing its job.
Benefits of Utilizing KPIs for Effective Asset Management
- Performance you can see. KPIs show trends and point to the assets and sites that need attention.
- Decisions based on data. Maintenance priorities, budgets and replacement plans rest on figures instead of opinion.
- Less unplanned downtime. MTBF, MTTR and PM compliance show where reliability is slipping before a major failure.
- Lower costs. Lifecycle cost and utilization show what to repair, replace, move or sell. See how a design consultant cut costs with Asset Infinity.
- Better use of assets. Idle equipment is redeployed instead of buying more.
- Compliance and lower risk. Compliance rate and register accuracy catch lapsed inspections and missing assets early.
- Accountability. Each KPI has an owner, and everyone can see how their work moves the figures.
- Alignment with business goals. KPIs link day-to-day maintenance and IT work to the asset management strategy.
Common Mistakes With Asset Management KPIs
- Tracking too many. Twenty KPIs on a dashboard means none of them is watched.
- Mixing definitions. Two sites counting downtime differently produce figures that cannot be compared.
- Measuring without acting. A KPI should lead to a decision, or it should be dropped.
- Rewarding one figure alone. Pushing MTTR down by closing work orders early hides repeat failures. Read KPIs together.
- Building the report by hand. A spreadsheet rebuilt every Monday is out of date by Tuesday.
How Asset Infinity Reports Asset Management KPIs
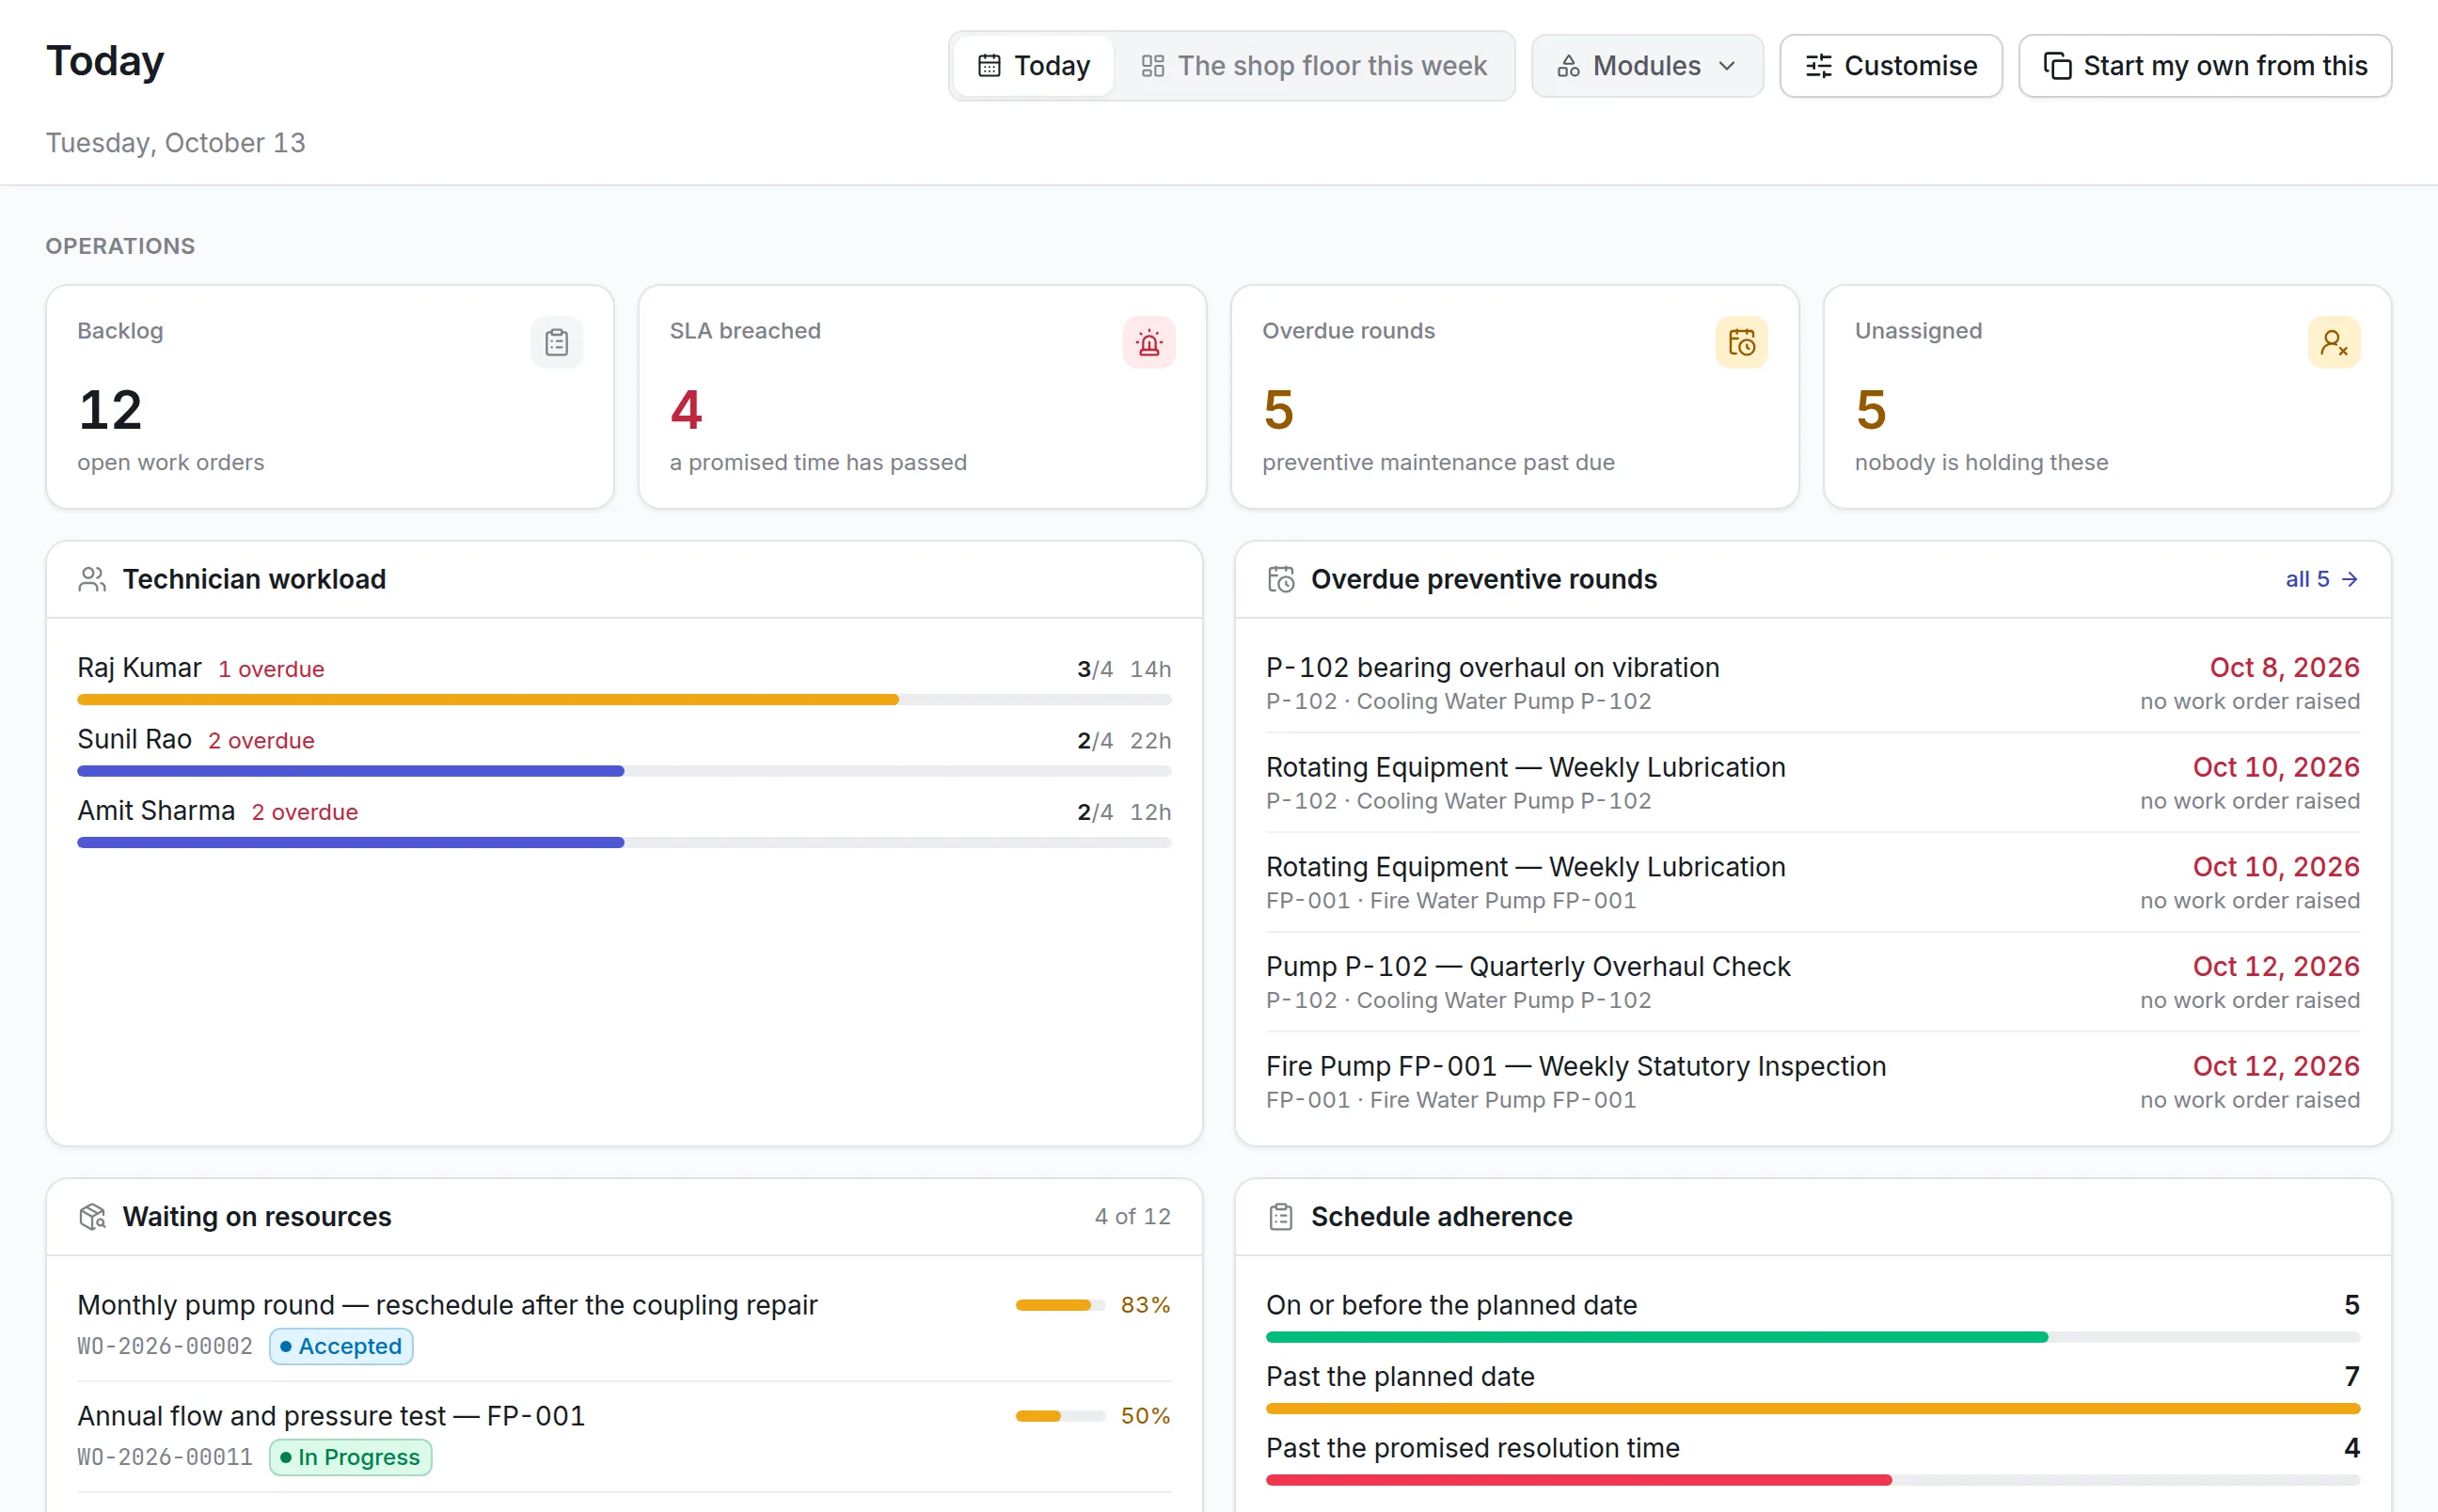
Asset Infinity counts KPIs from the work orders, asset history and stock records your team already keeps. See maintenance reporting and dashboards.
- Reliability figures. MTBF, MTTR, availability and PM compliance are worked out nightly from closed work and asset status history. MTBF shows no figure until an asset has at least two failures.
- Boards for each role. Ready-made boards cover work orders, planned maintenance, reliability, inventory, purchasing and more. You can duplicate one or build your own from widgets, with targets that color a tile amber or red.
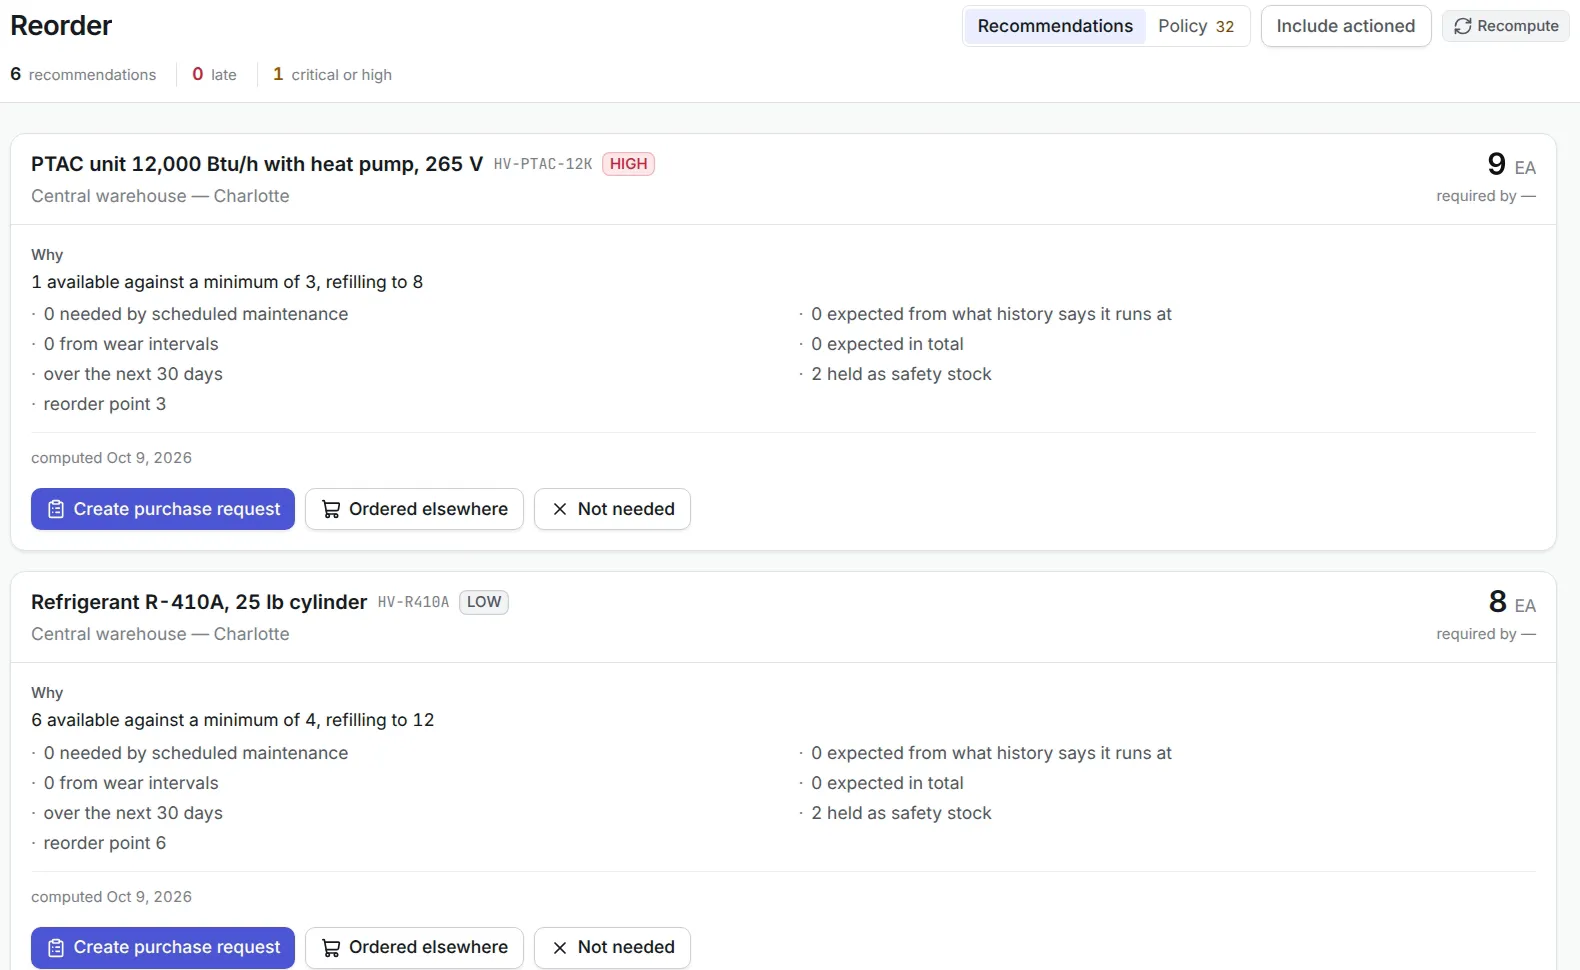
- Saved reports. Reports such as PM compliance by site, open work order ageing, planned versus reactive work, maintenance cost by site and asset cost to keep come with the product.
- IT and asset register reports. software license position, installed not entitled, blocked software installed, devices not checking in, verification round summary and book value by asset class. See IT asset management software.
- Scheduled delivery. Reports and boards are emailed daily, weekly or monthly as PDF, Excel or CSV.
- Access-aware sharing. Every figure is counted with the reader’s own access, so a shared board never shows someone data they could not otherwise open.
Frequently Asked Questions
What are the most important asset management KPIs?
Most teams start with asset utilization, MTBF, MTTR, availability, PM compliance and maintenance cost. Add lifecycle cost and register accuracy when replacement planning and audits matter.
What is the difference between a KPI and a metric?
A metric is any figure you can measure. A KPI is a metric tied to a goal, with a target and an owner.
How is MTBF calculated?
MTBF is total operating time divided by the number of failures in that time. A machine that ran 4,000 hours with four failures has an MTBF of 1,000 hours.
What are examples of IT asset management KPIs?
Inventory accuracy, discovery coverage, license compliance and utilization, hardware age, warranty coverage and the rate at which devices are recovered from leavers.
How often should asset management KPIs be reviewed?
Operational KPIs such as backlog and PM compliance are best reviewed weekly. Reliability, cost and lifecycle KPIs are usually reviewed monthly or quarterly.