


Asset utilization is how much of the time an asset is available that it actually spends doing productive work. A machine that could run 160 hours this month and ran 96 was 60% utilized, and the other 64 hours were capital sitting still. Raising that figure, or selling what you cannot raise, is one of the most direct ways to improve the return on what a business already owns.
This guide explains how to calculate the asset utilization rate, how to find underutilized assets, practical ways to improve asset utilization, how to handle peak seasons, and how to measure the ROI of the effort. It closes with what software adds and how Asset Infinity records the data utilization figures are built from.
What Is Asset Utilization?
Asset utilization measures how fully an organization uses its assets, usually as the share of available time an asset is in productive use. It applies to machines, vehicles, tools, rooms and IT equipment. A low figure points to idle capital, over-buying or downtime; a very high figure can point to wear and too little spare capacity.
The term is used at two levels. Operations teams measure utilization asset by asset, in hours. Finance teams measure it across the business, as revenue earned per dollar of assets. Both answer the same question: are we getting enough out of what we own?
How to Calculate the Asset Utilization Rate
The basic asset utilization rate is:
Asset utilization rate = actual productive time ÷ available time × 100
Available time is the time the asset could have run: scheduled shifts, opening hours or days in the period. Productive time leaves out downtime, setup and idle hours. Be consistent about what counts as available, or figures from two sites will not compare.
| Metric | Formula | What it tells you |
|---|---|---|
| Asset utilization rate | Productive time ÷ available time | How much of an asset’s available time is used |
| Booking utilization | Hours booked or checked out ÷ hours available | How often shared equipment and tools are in use |
| Overall equipment effectiveness (OEE) | Availability × performance × quality | How well a production asset runs when it runs |
| Fixed asset turnover | Net sales ÷ average net fixed assets | Revenue earned per dollar of fixed assets |
| Downtime | Hours out of service for repair or breakdown | What is pulling utilization down |
| Maintenance cost per hour run | Maintenance cost ÷ productive hours | Whether an asset costs more to keep than it earns |
There is no single good figure that suits every asset. A standby generator should be idle most of the time, while a production line running well below its plan is a problem. Set a target per asset class, compare like with like, and watch the trend. For production equipment, our guide to OEE software for manufacturing goes deeper on availability, performance and quality.
How to Identify Underutilized Assets
Underutilized assets are assets that are used well below their available capacity, or not at all. They tie up capital, still need storage, insurance and maintenance, and keep depreciating. Our article on the hidden cost of idle assets adds up what they cost.
You can find them with data you probably already have:
- Usage records. Meter readings, engine hours, odometer readings and check-out history show which assets barely move.
- Bookings with no demand. Shared equipment that is never booked, or always booked by the same person, is a candidate to move or sell.
- Status. Assets sitting in standby for months, or under maintenance for weeks, are not earning.
- Counts. A physical count often finds equipment in storerooms that nobody knew was there.
- Duplicate purchases. If a site bought an item another site has spare, the spare one is underutilized.
- Maintenance cost against use. An asset that costs more to maintain each month than the work it does is a replacement or disposal candidate.
How to Improve Asset Utilization
Once you know which assets are under-used, work through them in order of value. These steps cover most of what improves asset utilization.
- Build an accurate inventory. Record every asset with its location, custodian, status and condition. You cannot use what you cannot find.
- Measure usage the same way everywhere. Agree what counts as available time and record actual use from meters, trackers or bookings.
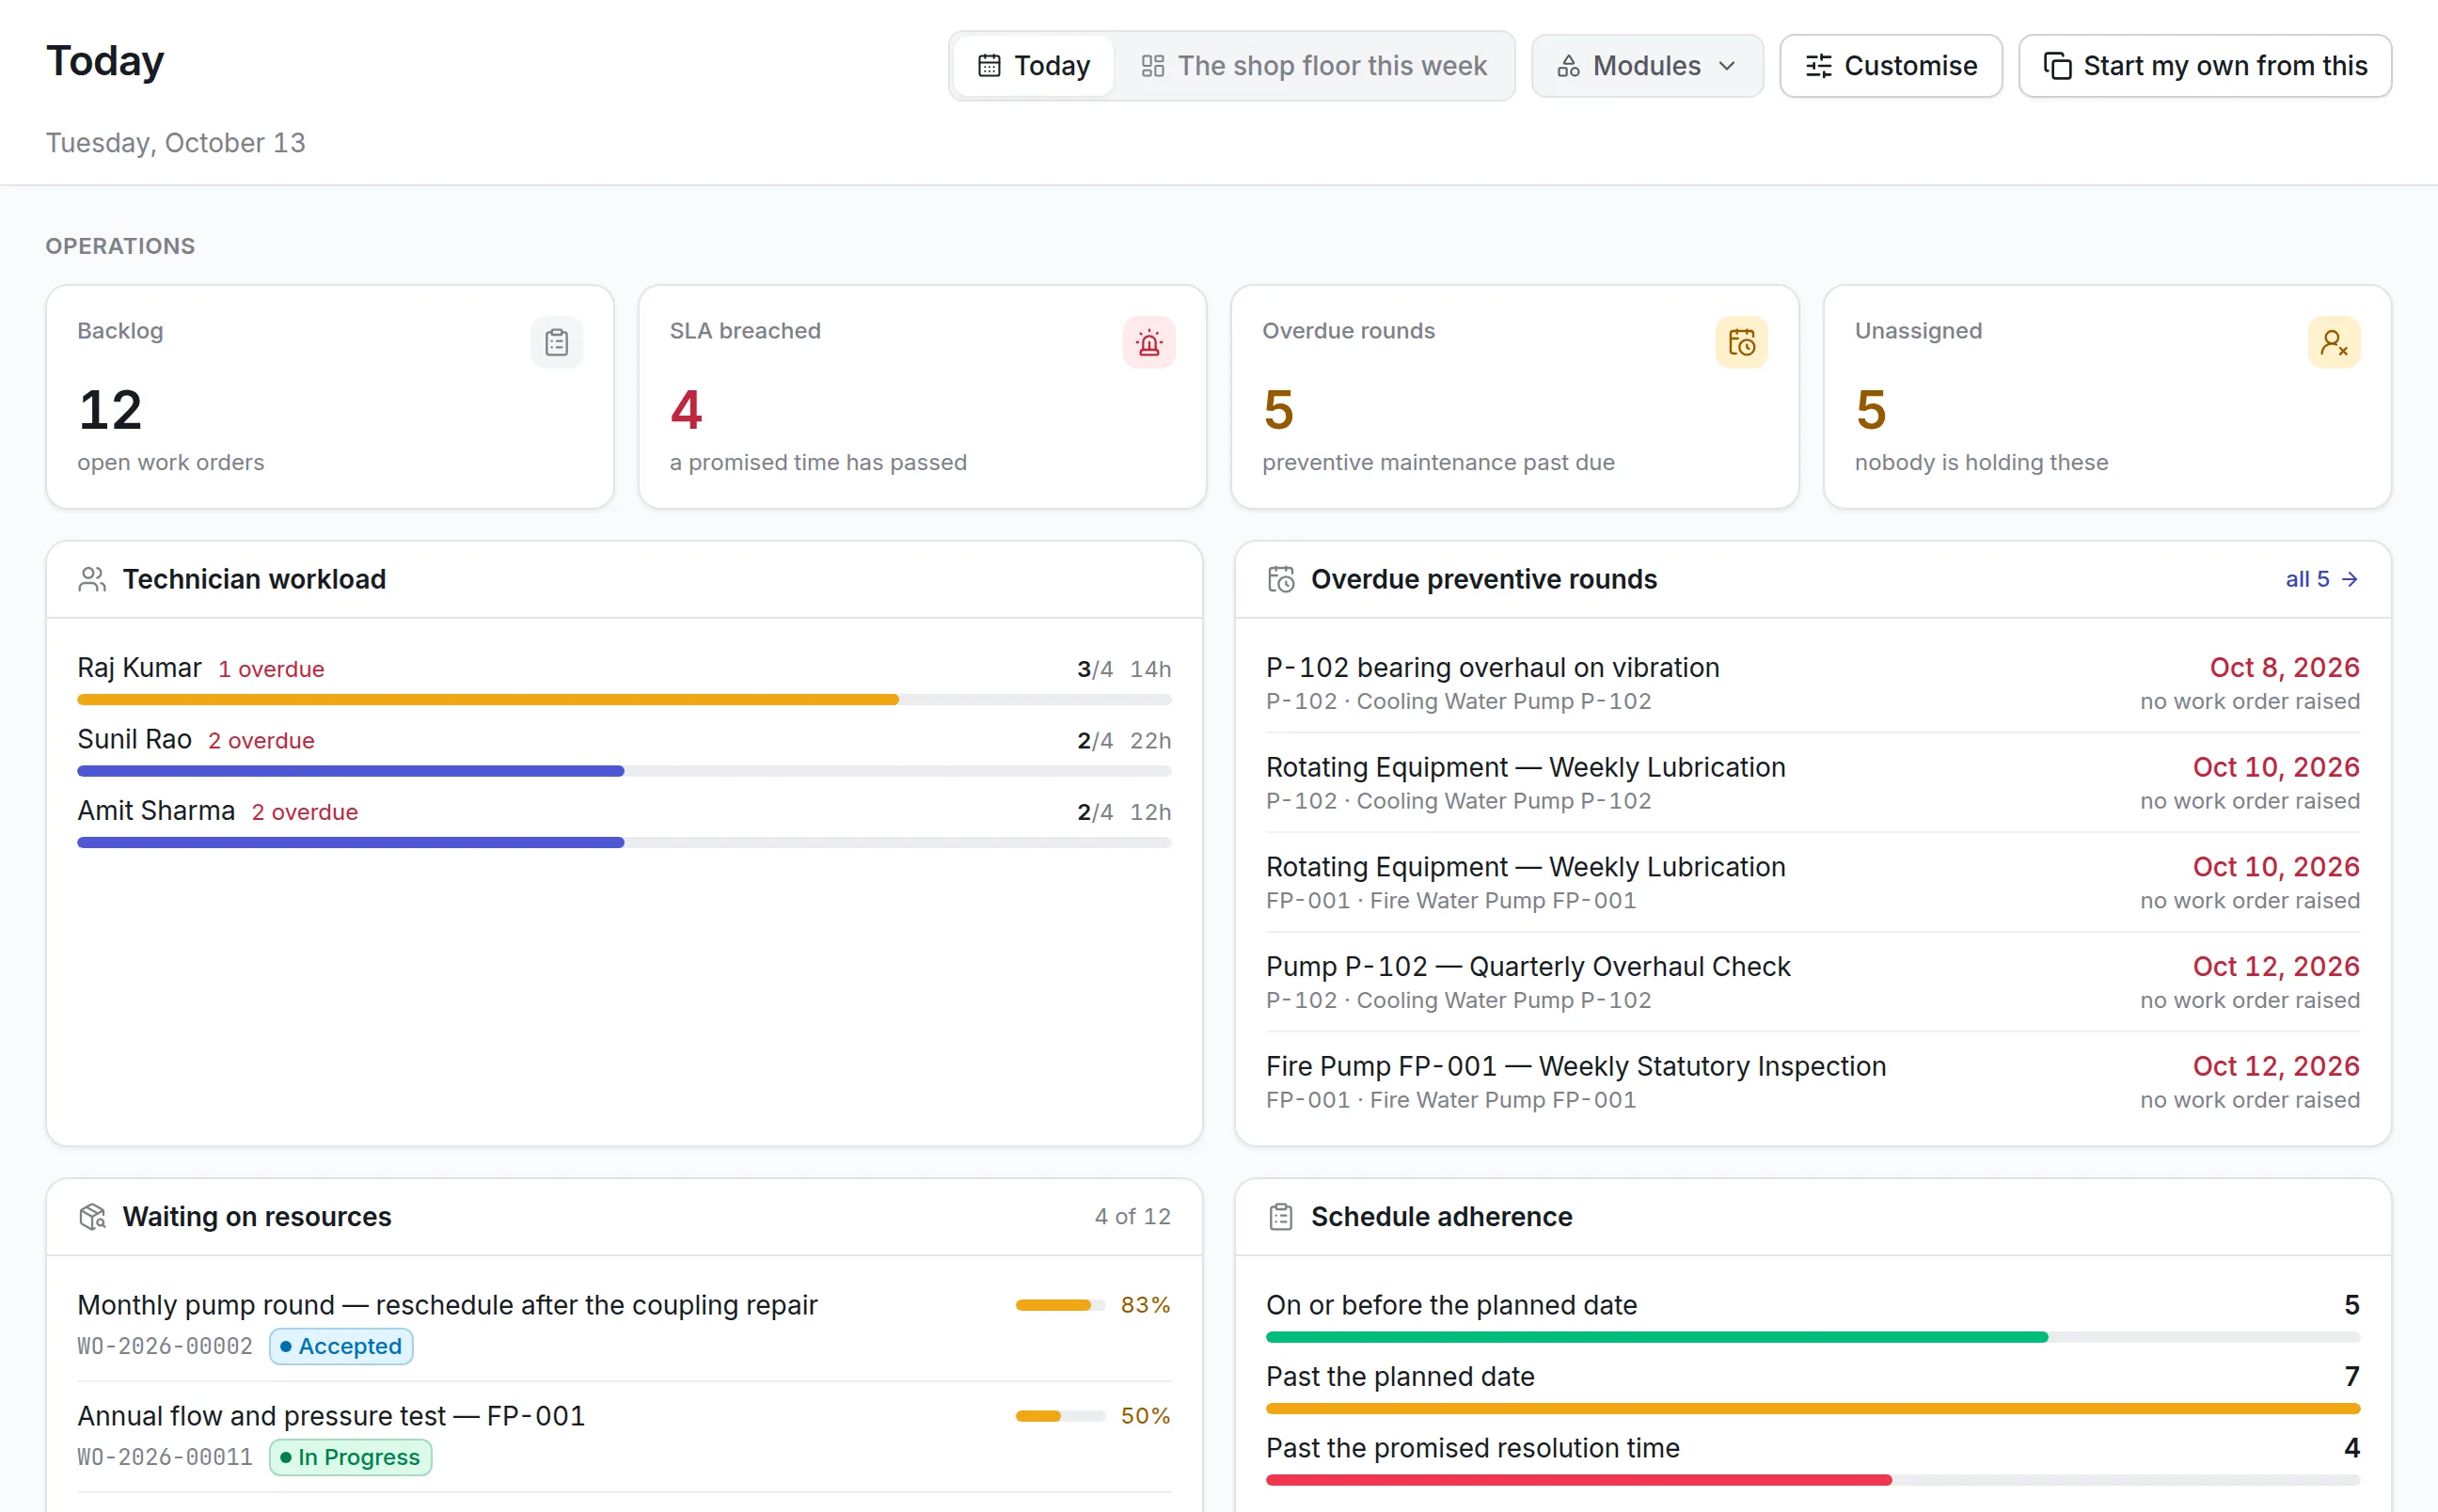
- Reduce downtime with preventive maintenance. Breakdowns are the biggest single drain on utilization for production assets. Preventive maintenance software schedules service by calendar or by meter so it happens before failure, and in quiet periods.
- Share equipment instead of buying more. Put tools, vehicles and devices in a shared pool with a booking calendar, so one site can use what another has idle.
- Reallocate idle assets. Move equipment from a department that barely uses it to one that needs it, and record the transfer.
- Rent out, sell or dispose of what nobody needs. Lease idle equipment to others where that fits your business, or sell it while it still has value, and free the capital.
- Train the people who use the assets. Misuse and poor setup cause downtime and early wear. Training on use and basic care helps assets stay available.
- Plan the lifecycle. Use maintenance cost and age to decide when replacing an asset returns more than repairing it.
- Review regularly. Look at utilization at least quarterly and act on the outliers at both ends.
Asset Utilization by Team
Manufacturing
Plants track run hours on production equipment and compare them with planned shifts. Downtime by cause shows whether maintenance, setup or material shortages hold utilization back, and preventive maintenance is planned for scheduled stops.
Fleets and Mobile Plant
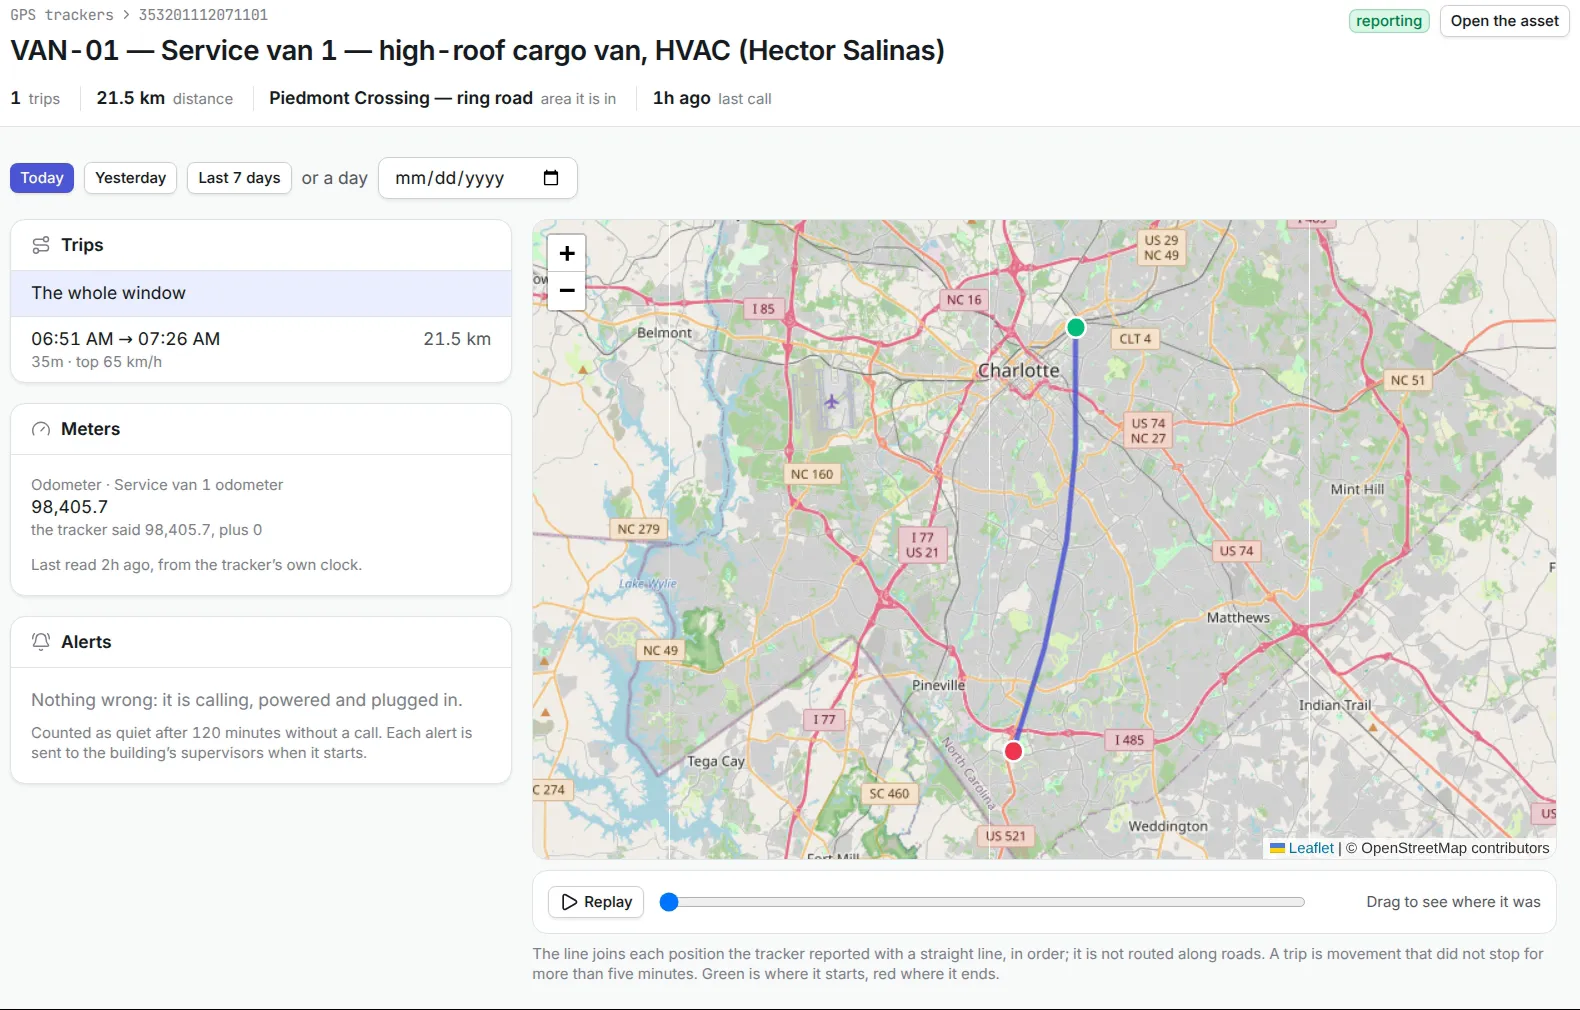
GPS trackers report trips, odometer readings and engine hours. Vehicles with low mileage are moved to busier routes or sold, and service falls due on actual use, so idle vehicles are not over-serviced.
Tool Cribs and Shared Equipment
Booking and check-out history show which tools go out every week and which never do. The idle ones are removed from the crib and the busy ones are bought in pairs.
IT Equipment
Laptops and monitors sitting in storage are spare stock to deploy before buying new. Devices that have stopped checking in are recovered or retired.
Asset Utilization in Peak Seasons
Peak periods, such as the holiday rush in retail, logistics and hospitality, push equipment harder and leave no room for a breakdown. The aim before a peak is to have every asset available and nothing waiting on repair.
- Service before the rush. Bring forward preventive maintenance on point-of-sale systems, forklifts, vehicles and kitchen equipment so it is done before demand rises.
- Check spare capacity. Know which idle assets can be moved to the busiest sites, and book shared equipment in advance.
- Watch the parts stock. Have the spare parts for critical assets on the shelf, so one failure does not stop a store or a dock.
- Review afterwards. Compare utilization during the peak with the rest of the year to decide what to buy, rent or sell.
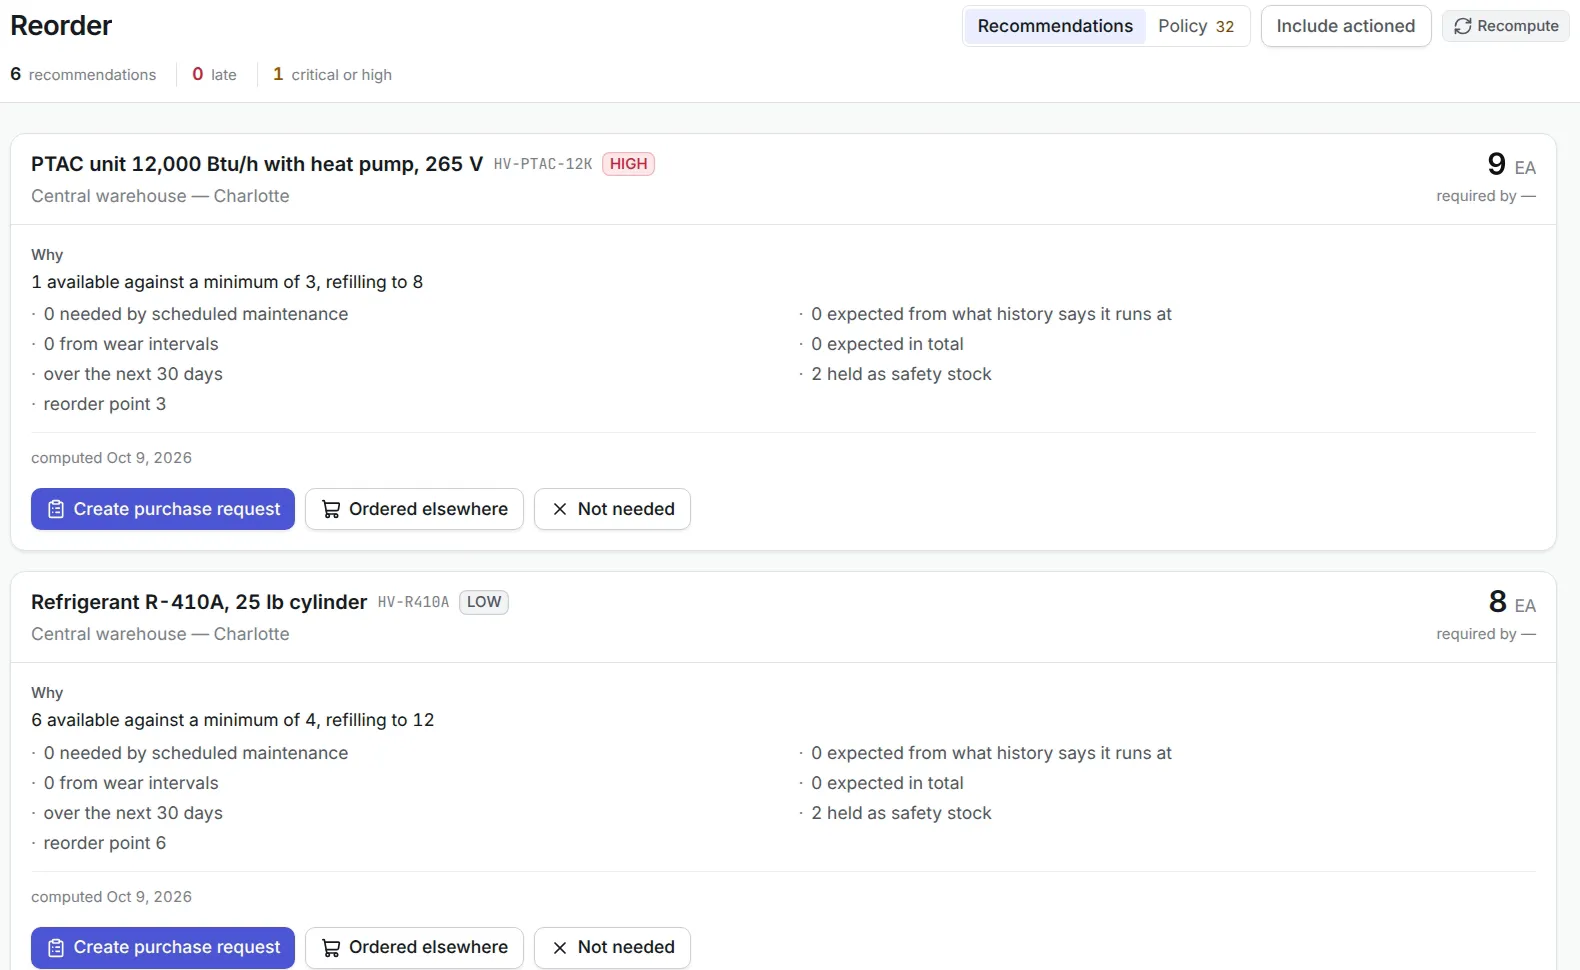
Cloud-based (SaaS) asset management helps here because every site works from the same live records, so a manager can see a spare forklift in another depot instead of hiring one.
Measuring the ROI of Asset Utilization
Return on investment is net gain divided by the cost of the investment. For asset utilization, compare a set of metrics before and after the changes, and put a dollar figure against each one:
| Metric | What to compare | How it turns into ROI |
|---|---|---|
| Utilization rate | Before and after, per asset class | More output from the same assets |
| Purchases avoided | Items supplied from idle stock instead of bought | Capital not spent |
| Assets sold or rented out | Proceeds and income from idle assets | Cash returned |
| Downtime | Hours lost to breakdowns | Production and revenue recovered |
| Maintenance cost | Emergency repairs and overtime | Direct cost saved |
| Asset life | Years in service before replacement | Replacement deferred |
| Energy use | Consumption per unit of output | Running cost saved |
Divide the total gain by what you spent on tracking, maintenance and process changes to get the ROI of your asset management optimization.
What Software Adds to Asset Utilization
Spreadsheets can hold a utilization figure, but they cannot collect the usage behind it. Software records it as work happens:
| Capability | Why it matters for utilization |
|---|---|
| One register with status and location | Shows idle and standby assets across every site |
| Meters fed by trackers and readings | Usage measured, not guessed |
| Booking and check-out history | Shows demand for shared equipment |
| Maintenance history and cost | Shows downtime and cost per asset |
| Transfers and disposals | Records each reallocation and sale |
| Reports | Turns all of it into a figure per asset and site |
How Asset Infinity Records Asset Utilization Data
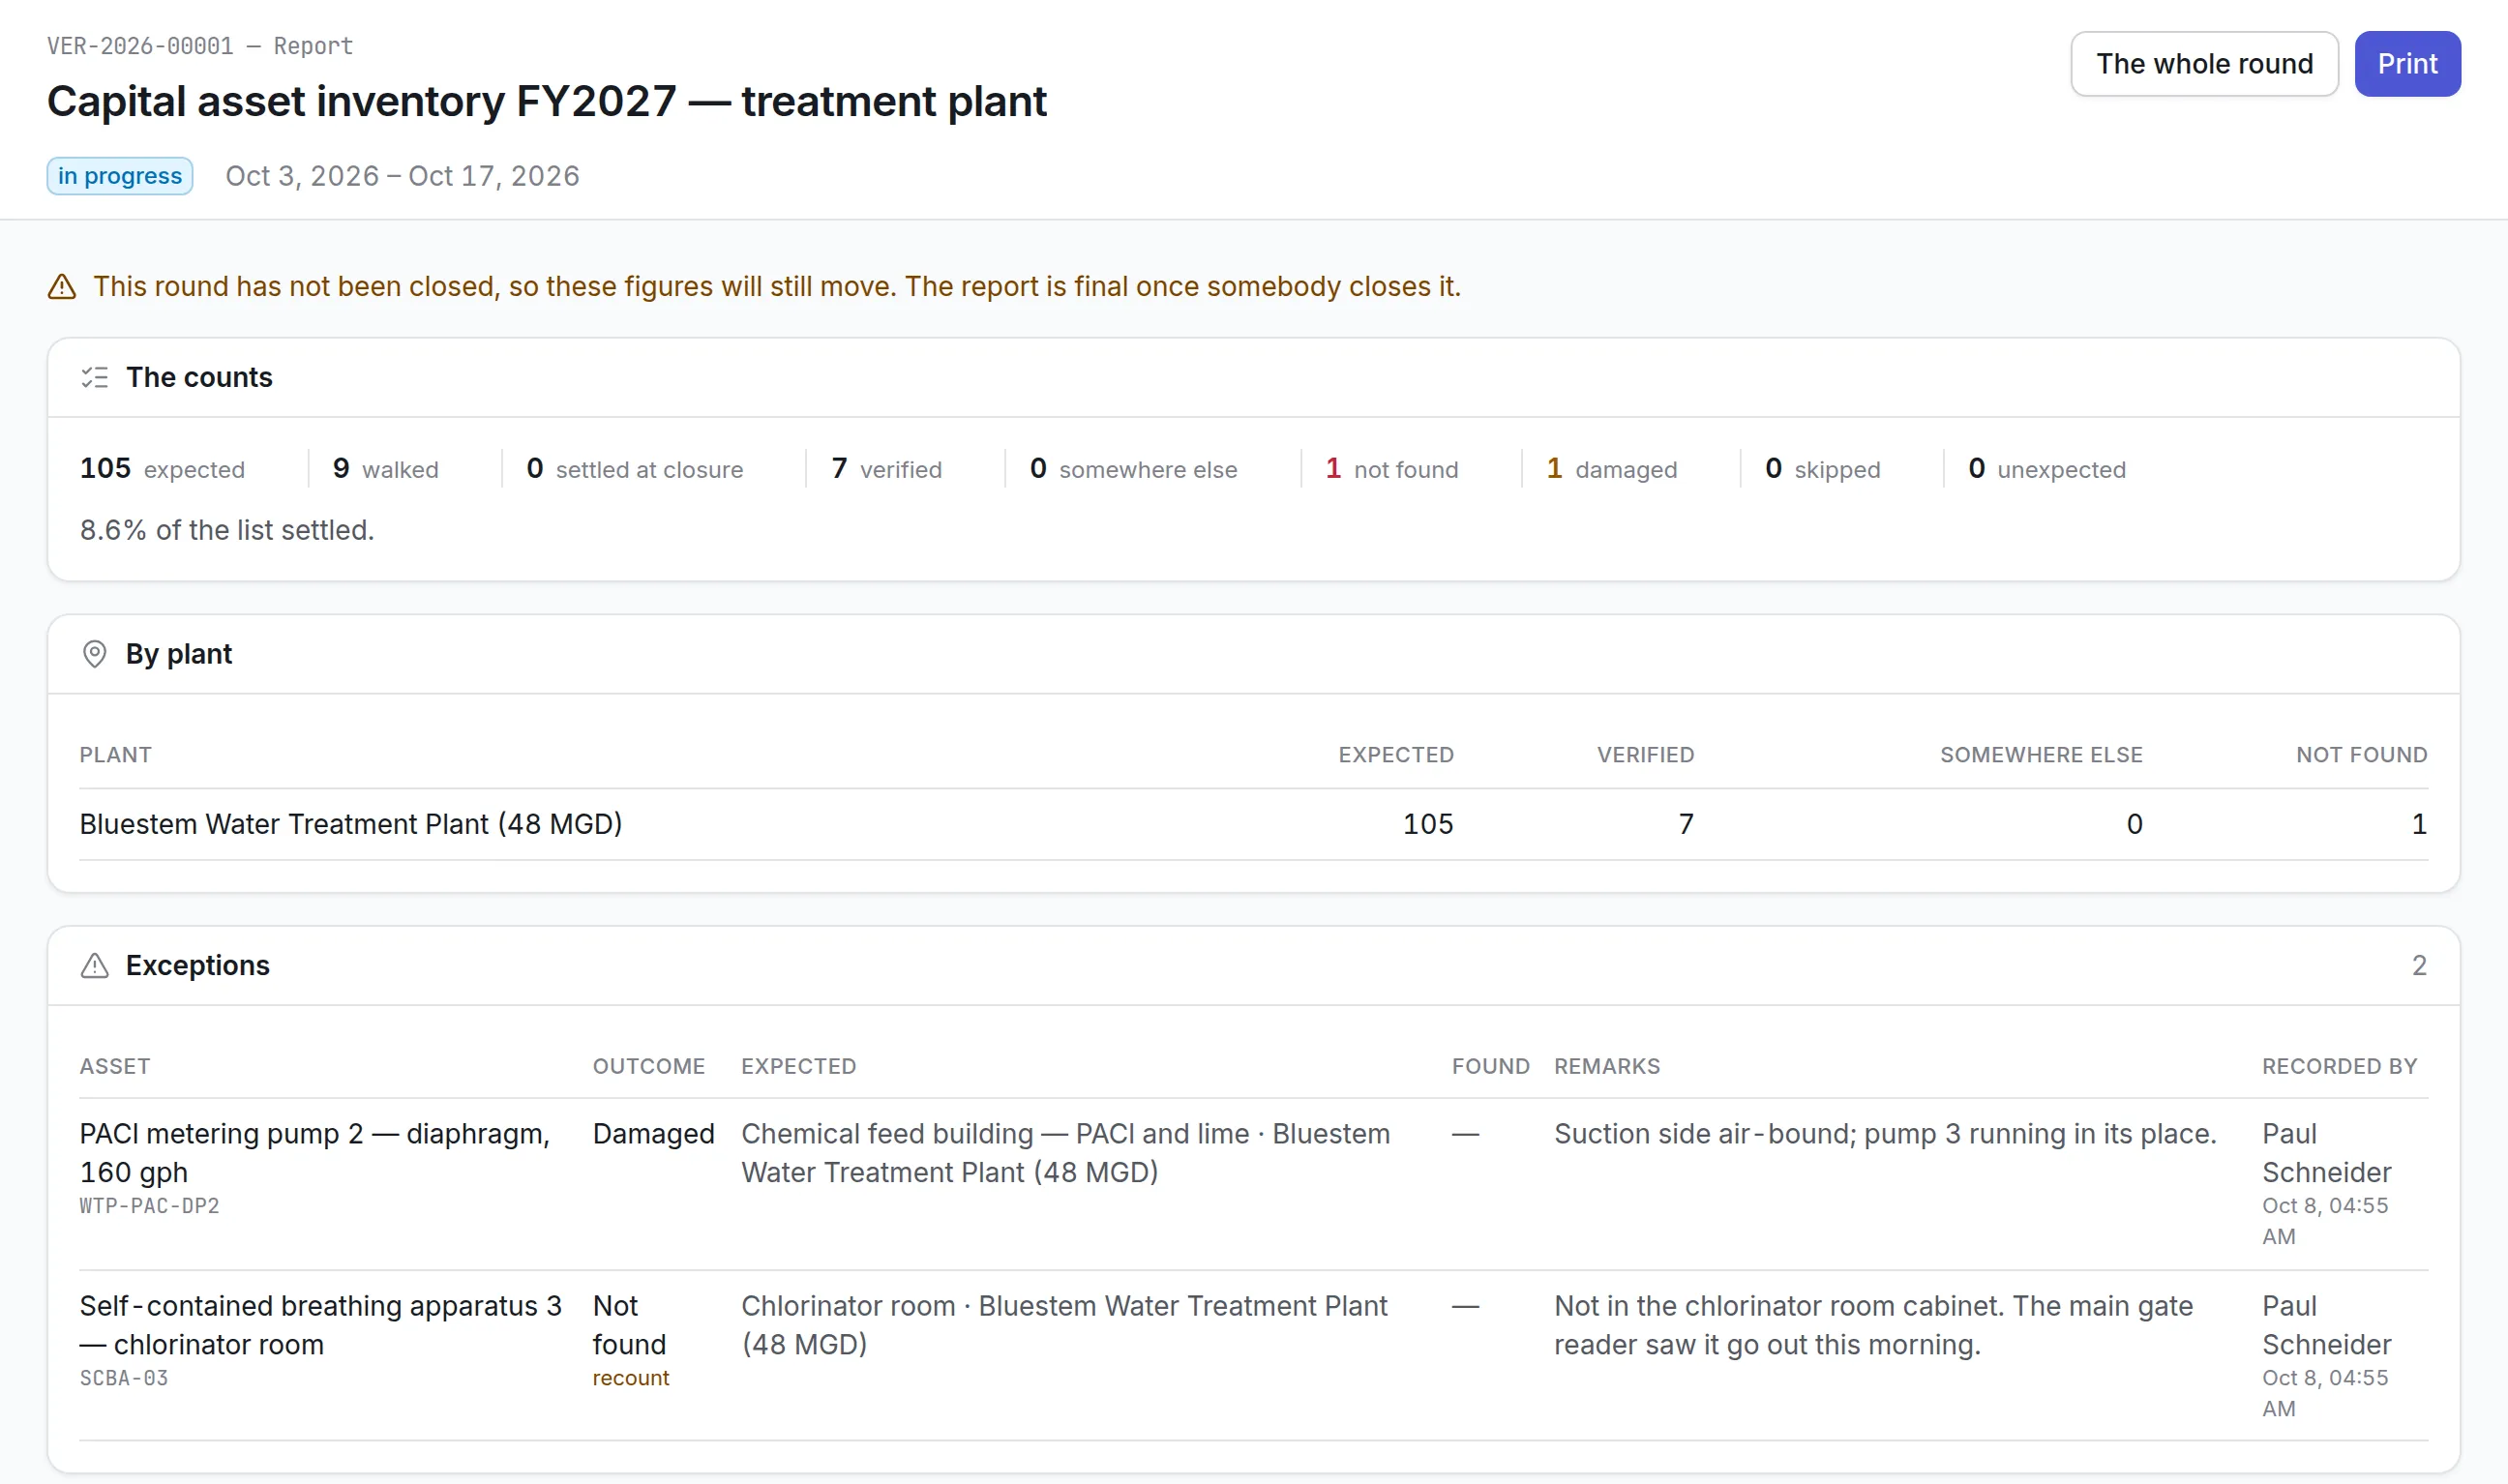
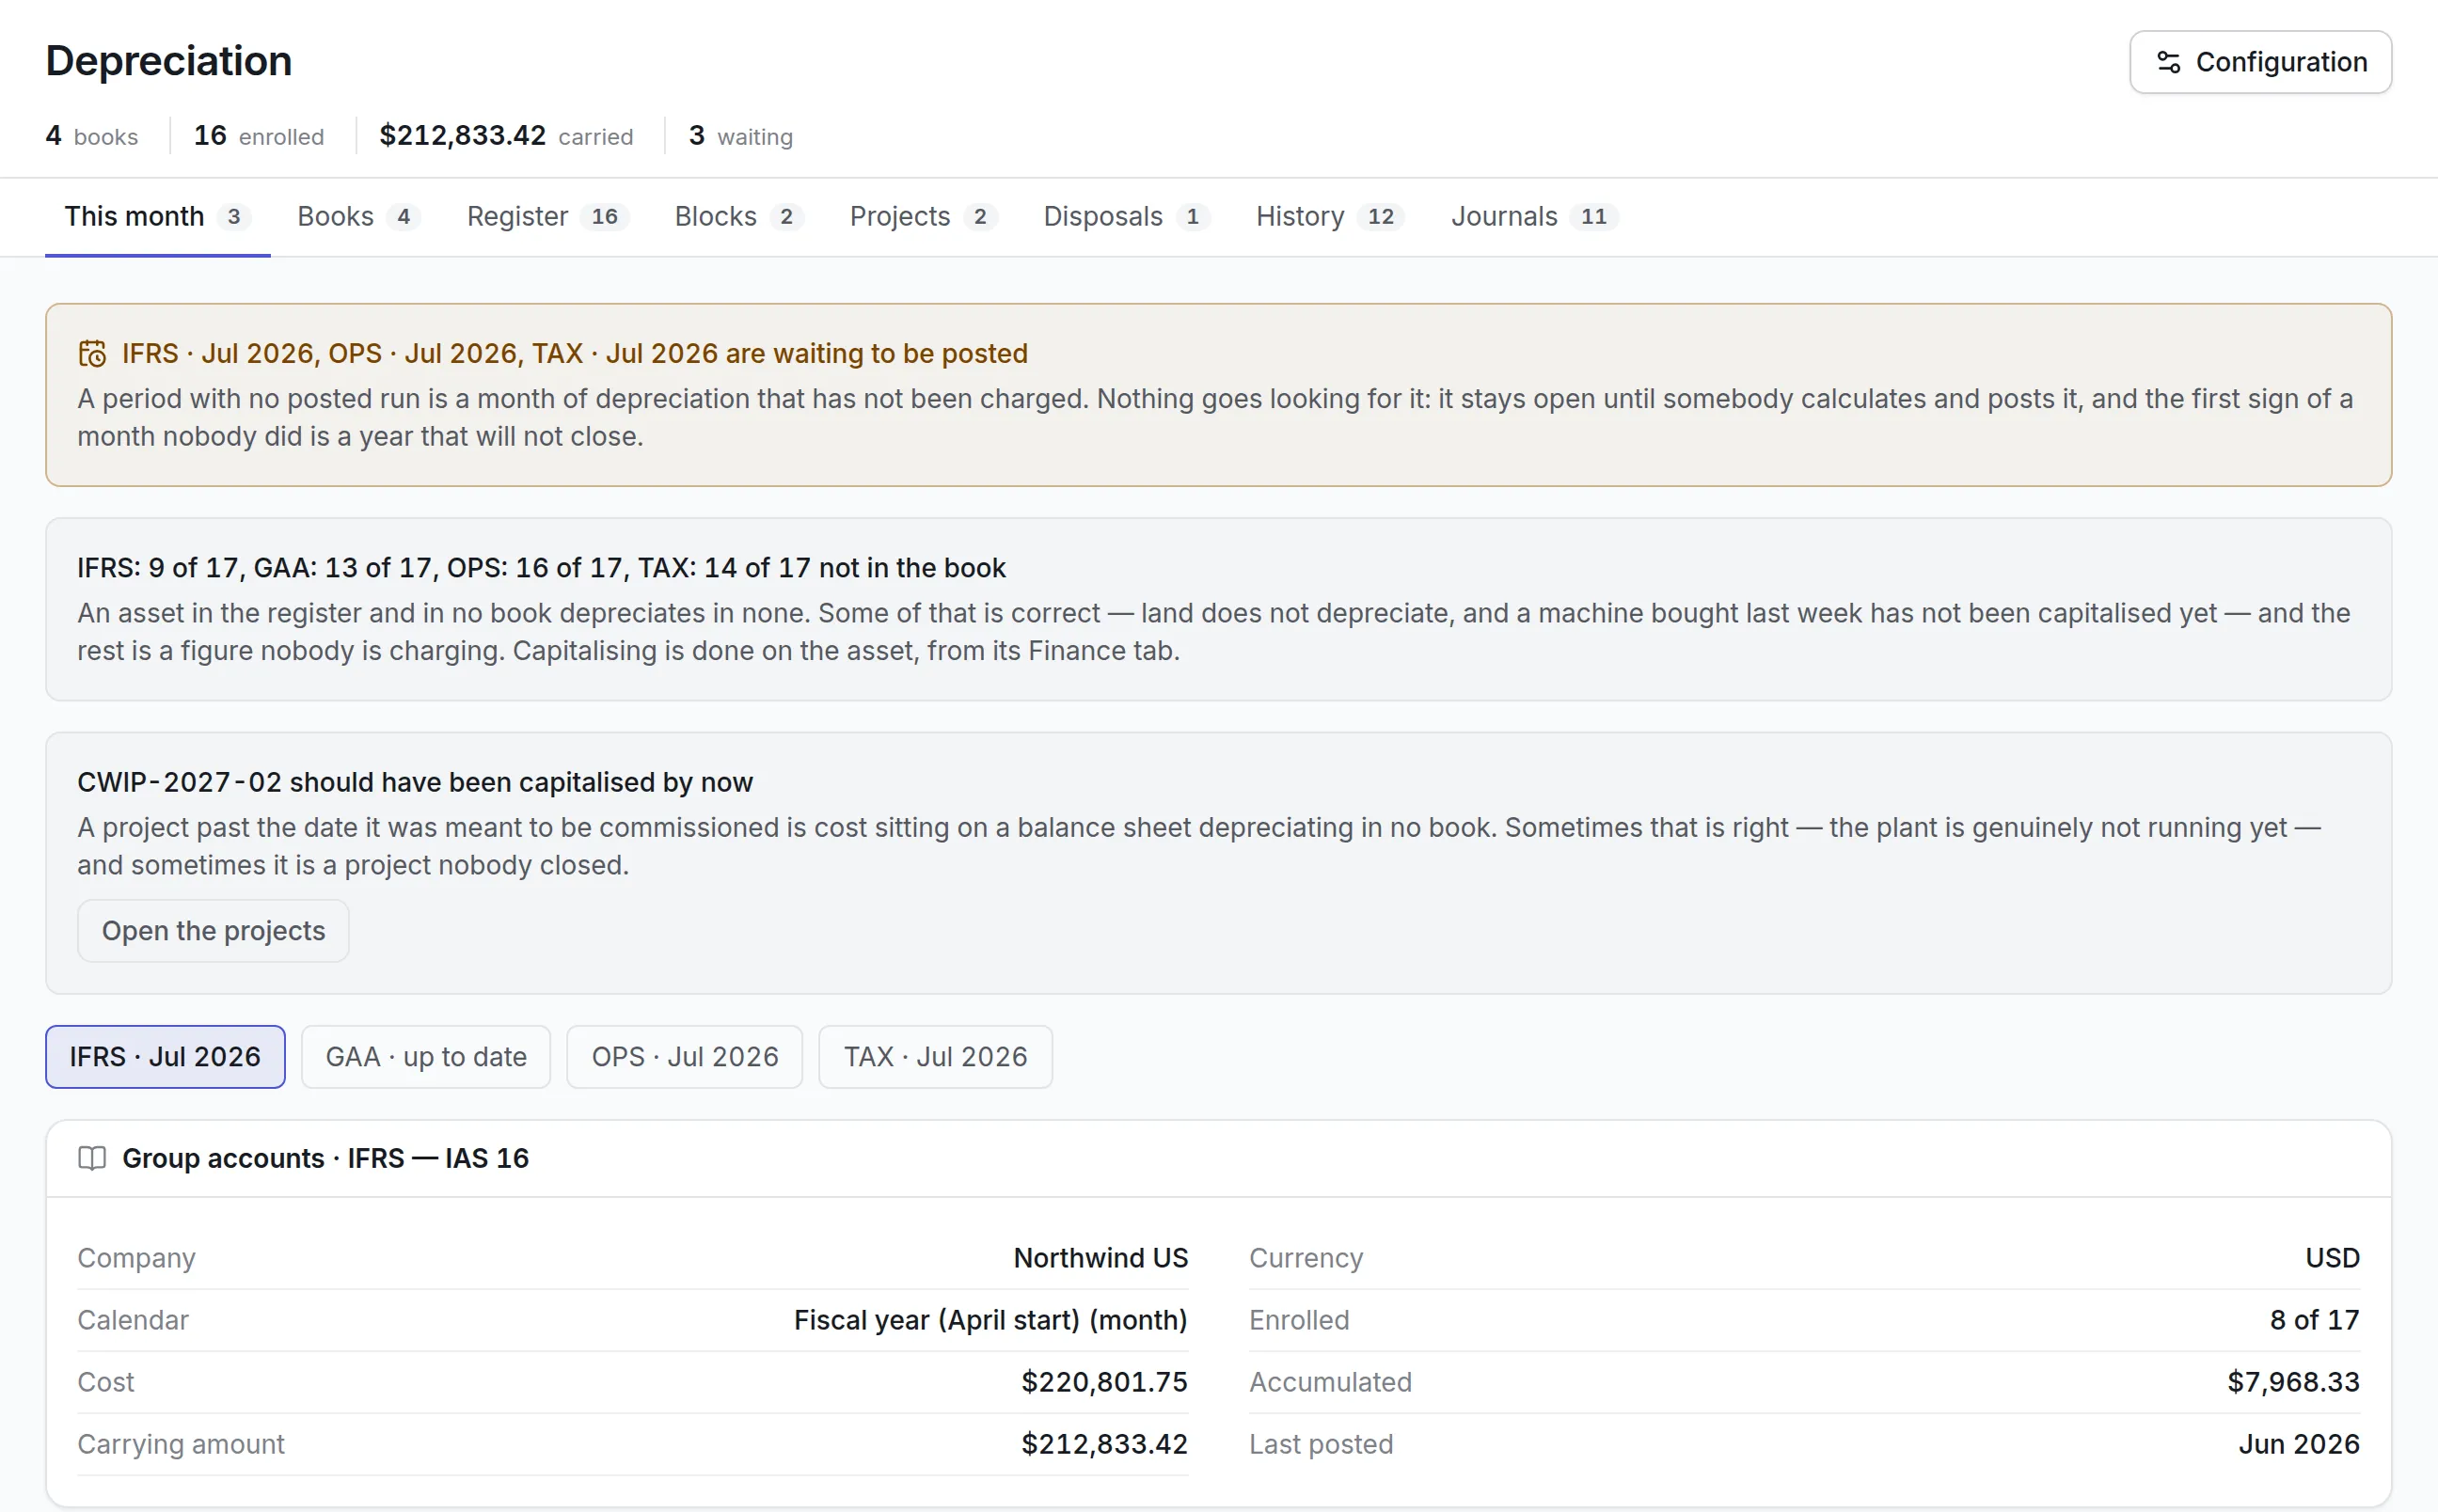
Asset Infinity holds every asset in one register with a status (Planned, Standby, Operational, Under Maintenance, Breakdown, Retired or Disposed) and keeps the status history, so you can see how long an asset has been standing idle or out of service. Moves and bulk transfers record each reallocation, and disposals record the reason (sold, scrapped, lost, donated or transferred), the sale price and the gain or loss.
Usage comes from several places. GPS asset tracking feeds odometer and engine hours into each asset’s meters, and meter-based service plans fall due on actual use. Equipment checkout records every booking line against an asset, which is what a utilization figure is made from, along with who took it and the condition it came back in. A pack of standard reports and a report builder in maintenance reporting turn this into figures by asset and site. See pricing for your number of assets.
Frequently Asked Questions
What is a good asset utilization rate?
It depends on the asset. Production equipment should run close to its planned hours, while standby and safety equipment is meant to be idle most of the time. Set a target for each asset class and track the trend.
What causes low asset utilization?
Breakdowns and long repairs, buying more than demand needs, assets nobody can find, poor scheduling, and equipment kept after the work it served has ended.
How often should asset utilization be reviewed?
Review it at least quarterly, and monthly for high-value or heavily used assets. Review again before and after a peak season.
What is the difference between asset utilization and asset turnover?
Asset utilization usually measures time in use for each asset. Asset turnover is a financial ratio of revenue to assets for the whole business. Better utilization tends to raise turnover.