

Energy management software that finds the asset wasting power
Energy management software that records utility readings for every site, building and metered asset. It compares each supply point with its own past and with comparable ones, and lists the gaps worth a technician's visit.
What our energy management software finds for you
Supply points for sites and assets
Meter a building's incoming main, a water connection or a single machine. Each supply point belongs to a site, and to an asset when it meters one.
Readings that survive real meters
Readings handle registers that roll over, meters that are exchanged and utility estimates that are later corrected, so consumption stays right.
Findings worth acting on
Each finding says how far a supply point is over, against what and for which period, and ranks it urgent, important or advisory.
Weather taken out
Heating and cooling loads are compared against last year with the weather taken out, and only against supply points driven the same way.
Cost and carbon
Tariffs turn consumption into cost, and emission factors into kilograms of CO2e, for each supply point and period.
Feeding maintenance
A supply point tied to an asset's meter passes its readings to that meter, so usage-based maintenance plans run on the same numbers.
What is energy management software?
Energy management software records how much electricity, gas, water, fuel and steam an organization uses, where it is used and what it costs, and then points out where consumption has moved without anybody deciding it should. Facilities and maintenance teams use energy management software to find faults, compare sites and track reduction targets.
A chart of kilowatt-hours mostly shows a building being a building. What a team needs is the short list of places where use has changed, and enough detail to send a technician. That is the gap between a utility dashboard and a tool maintenance can act on.
How energy management software works in Asset Infinity
Everything starts from a supply point: the place a commodity is measured, such as a building’s incoming electricity main, a gas line, a water connection, a submeter on one production cell or a generator’s fuel tank. Each one belongs to a site, and can be narrowed to a location or to the single asset it meters.
- Set up commodities, tariffs and factors.Commodities have a unit and a category of utility, fuel, generated or recovered. Tariffs and emission factors are dated, so each reading is priced and costed at the rate in force on its day.
- Add supply points.Mark each one billed, submeter, check meter or generation, so submeters are never counted twice in a site total. Record the multiplier, the rollover value and the reading it started from.
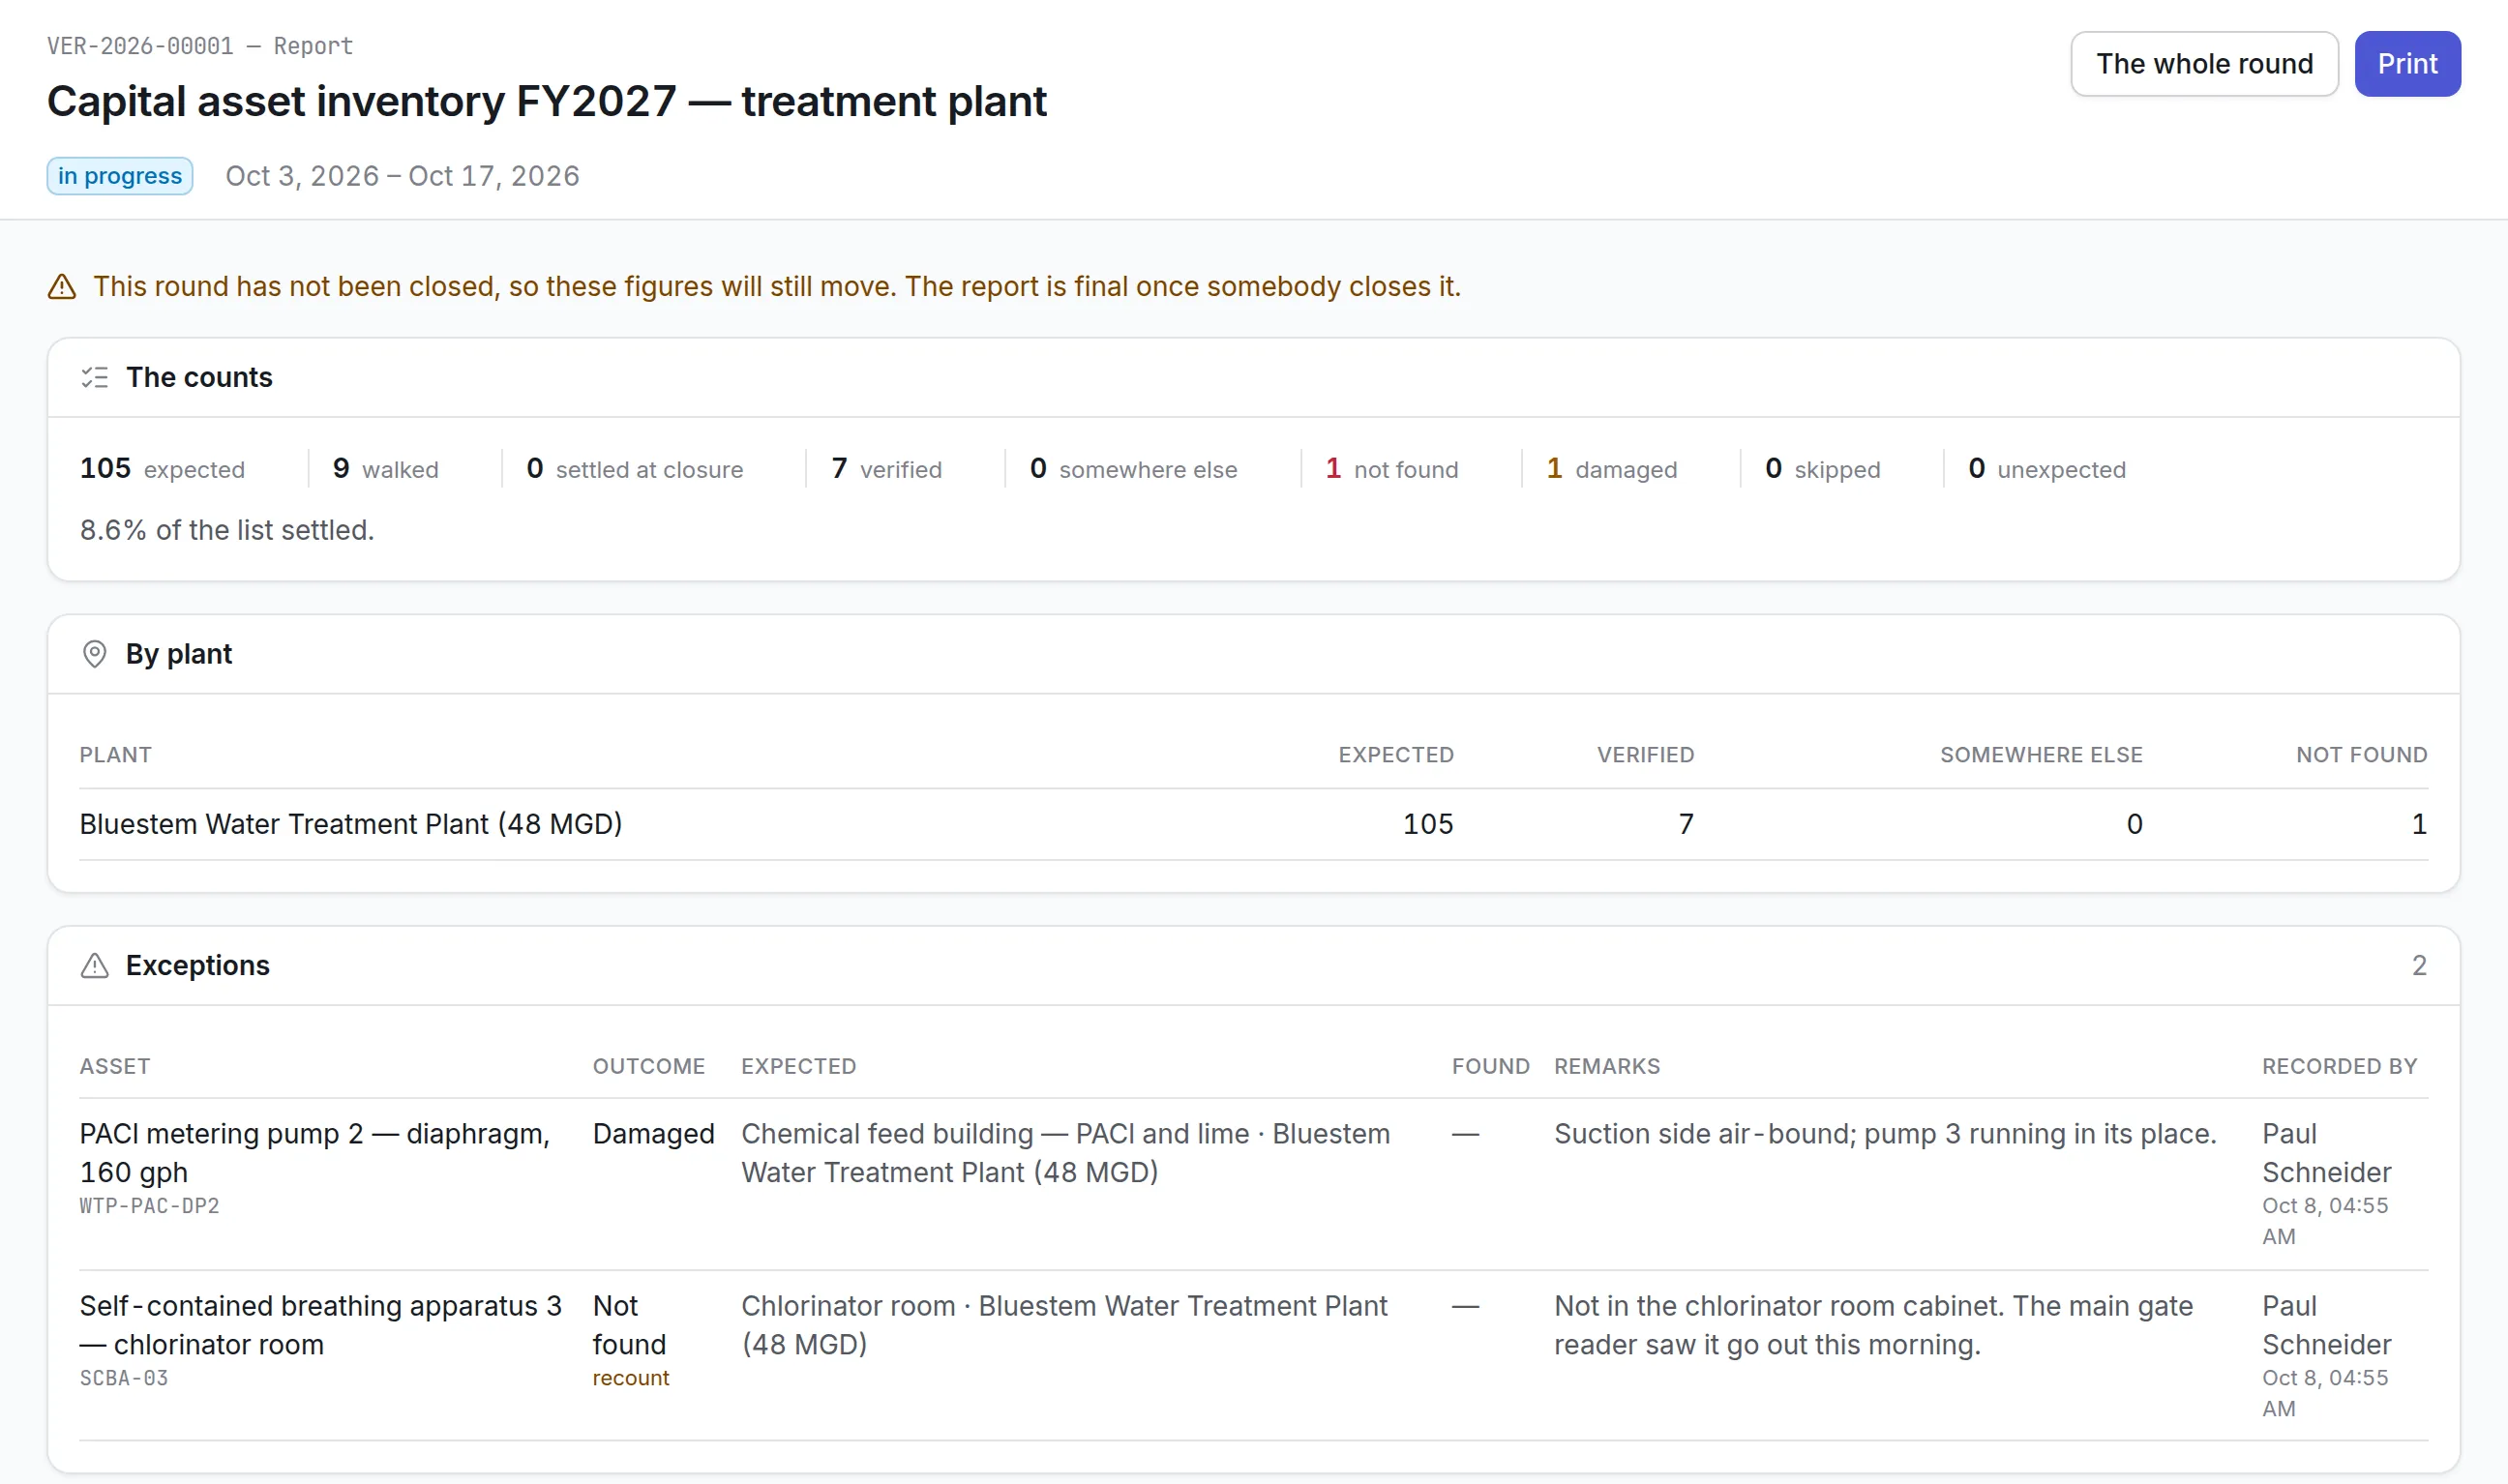
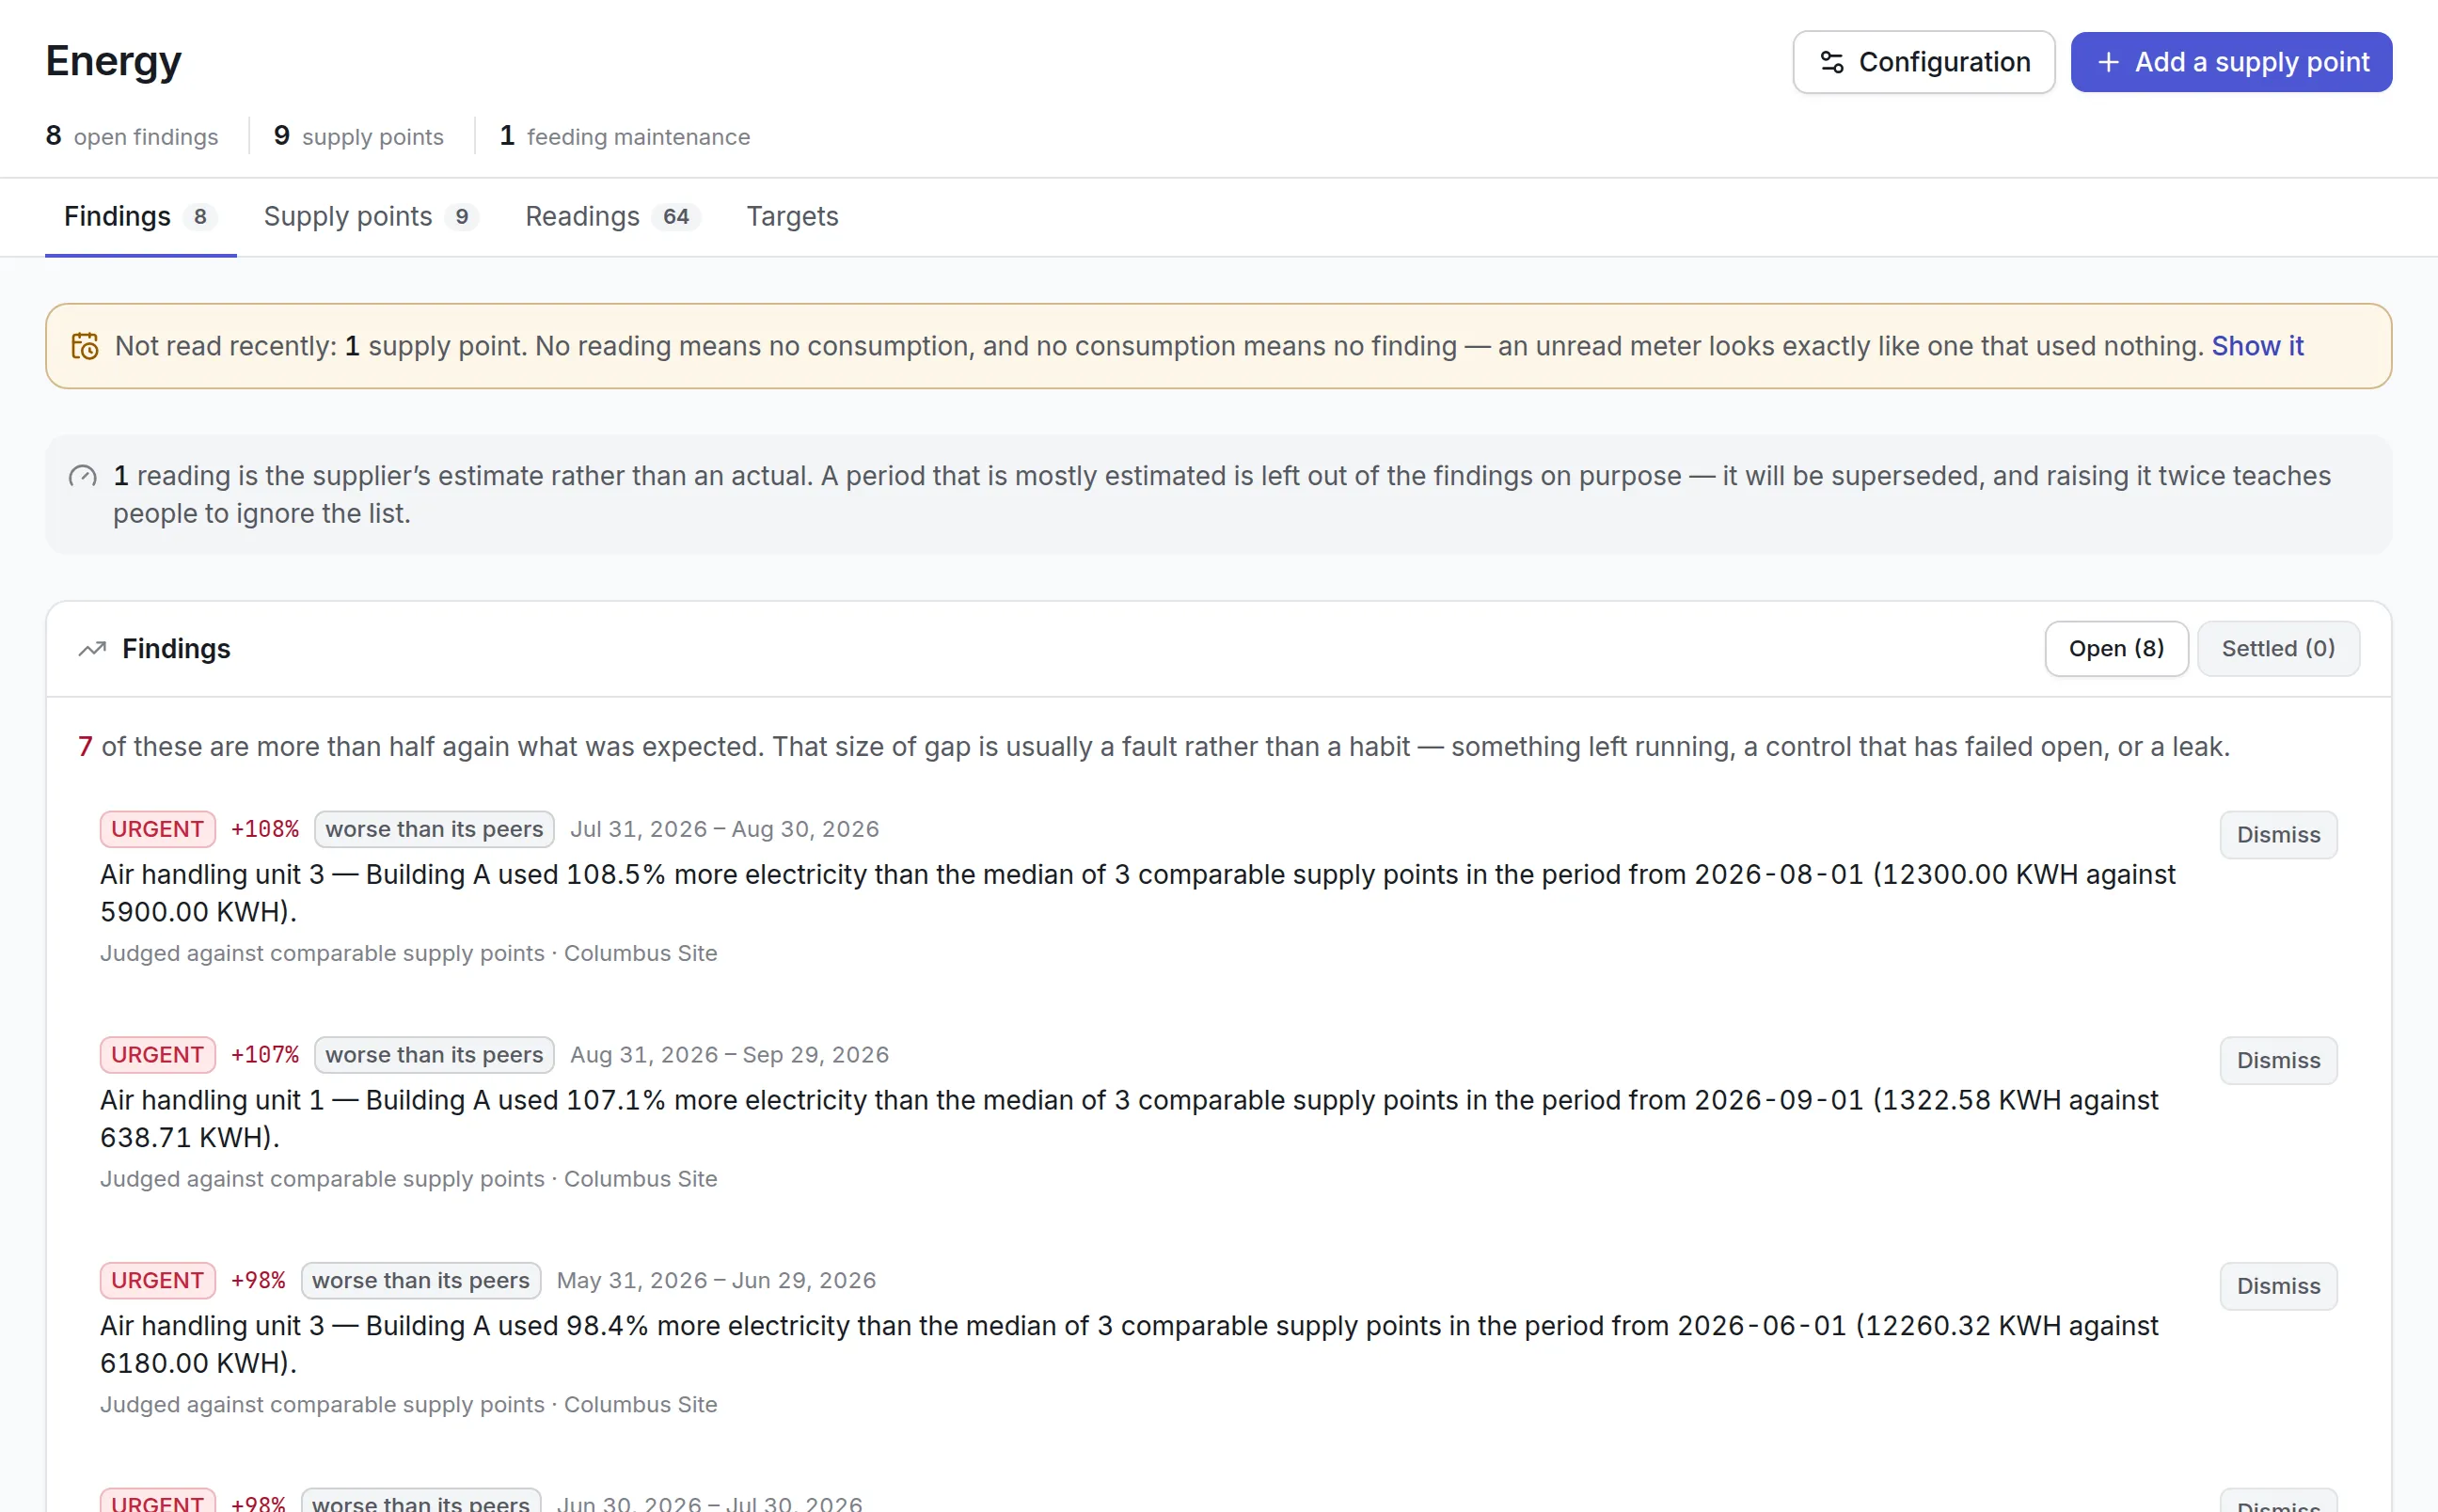
- Record readings.Type what the dial reads, transcribe a bill with its amount, take readings on the handset’s meter round, or let sensors and imports bring them in.
- Let the nightly check compare.Each period is compared with the supply point’s own history and with its peers, and a finding is written when the gap is wider than the baseline allows.
- Act or dismiss with a reason.A finding can raise a work order, or be dismissed with a reason the next person reads, such as new equipment commissioned in March.
- Track targets.A target commits to so much less of a commodity over a period against a named baseline period, and shows whether it is on track, behind or missed.
Findings ranked by how far over they are
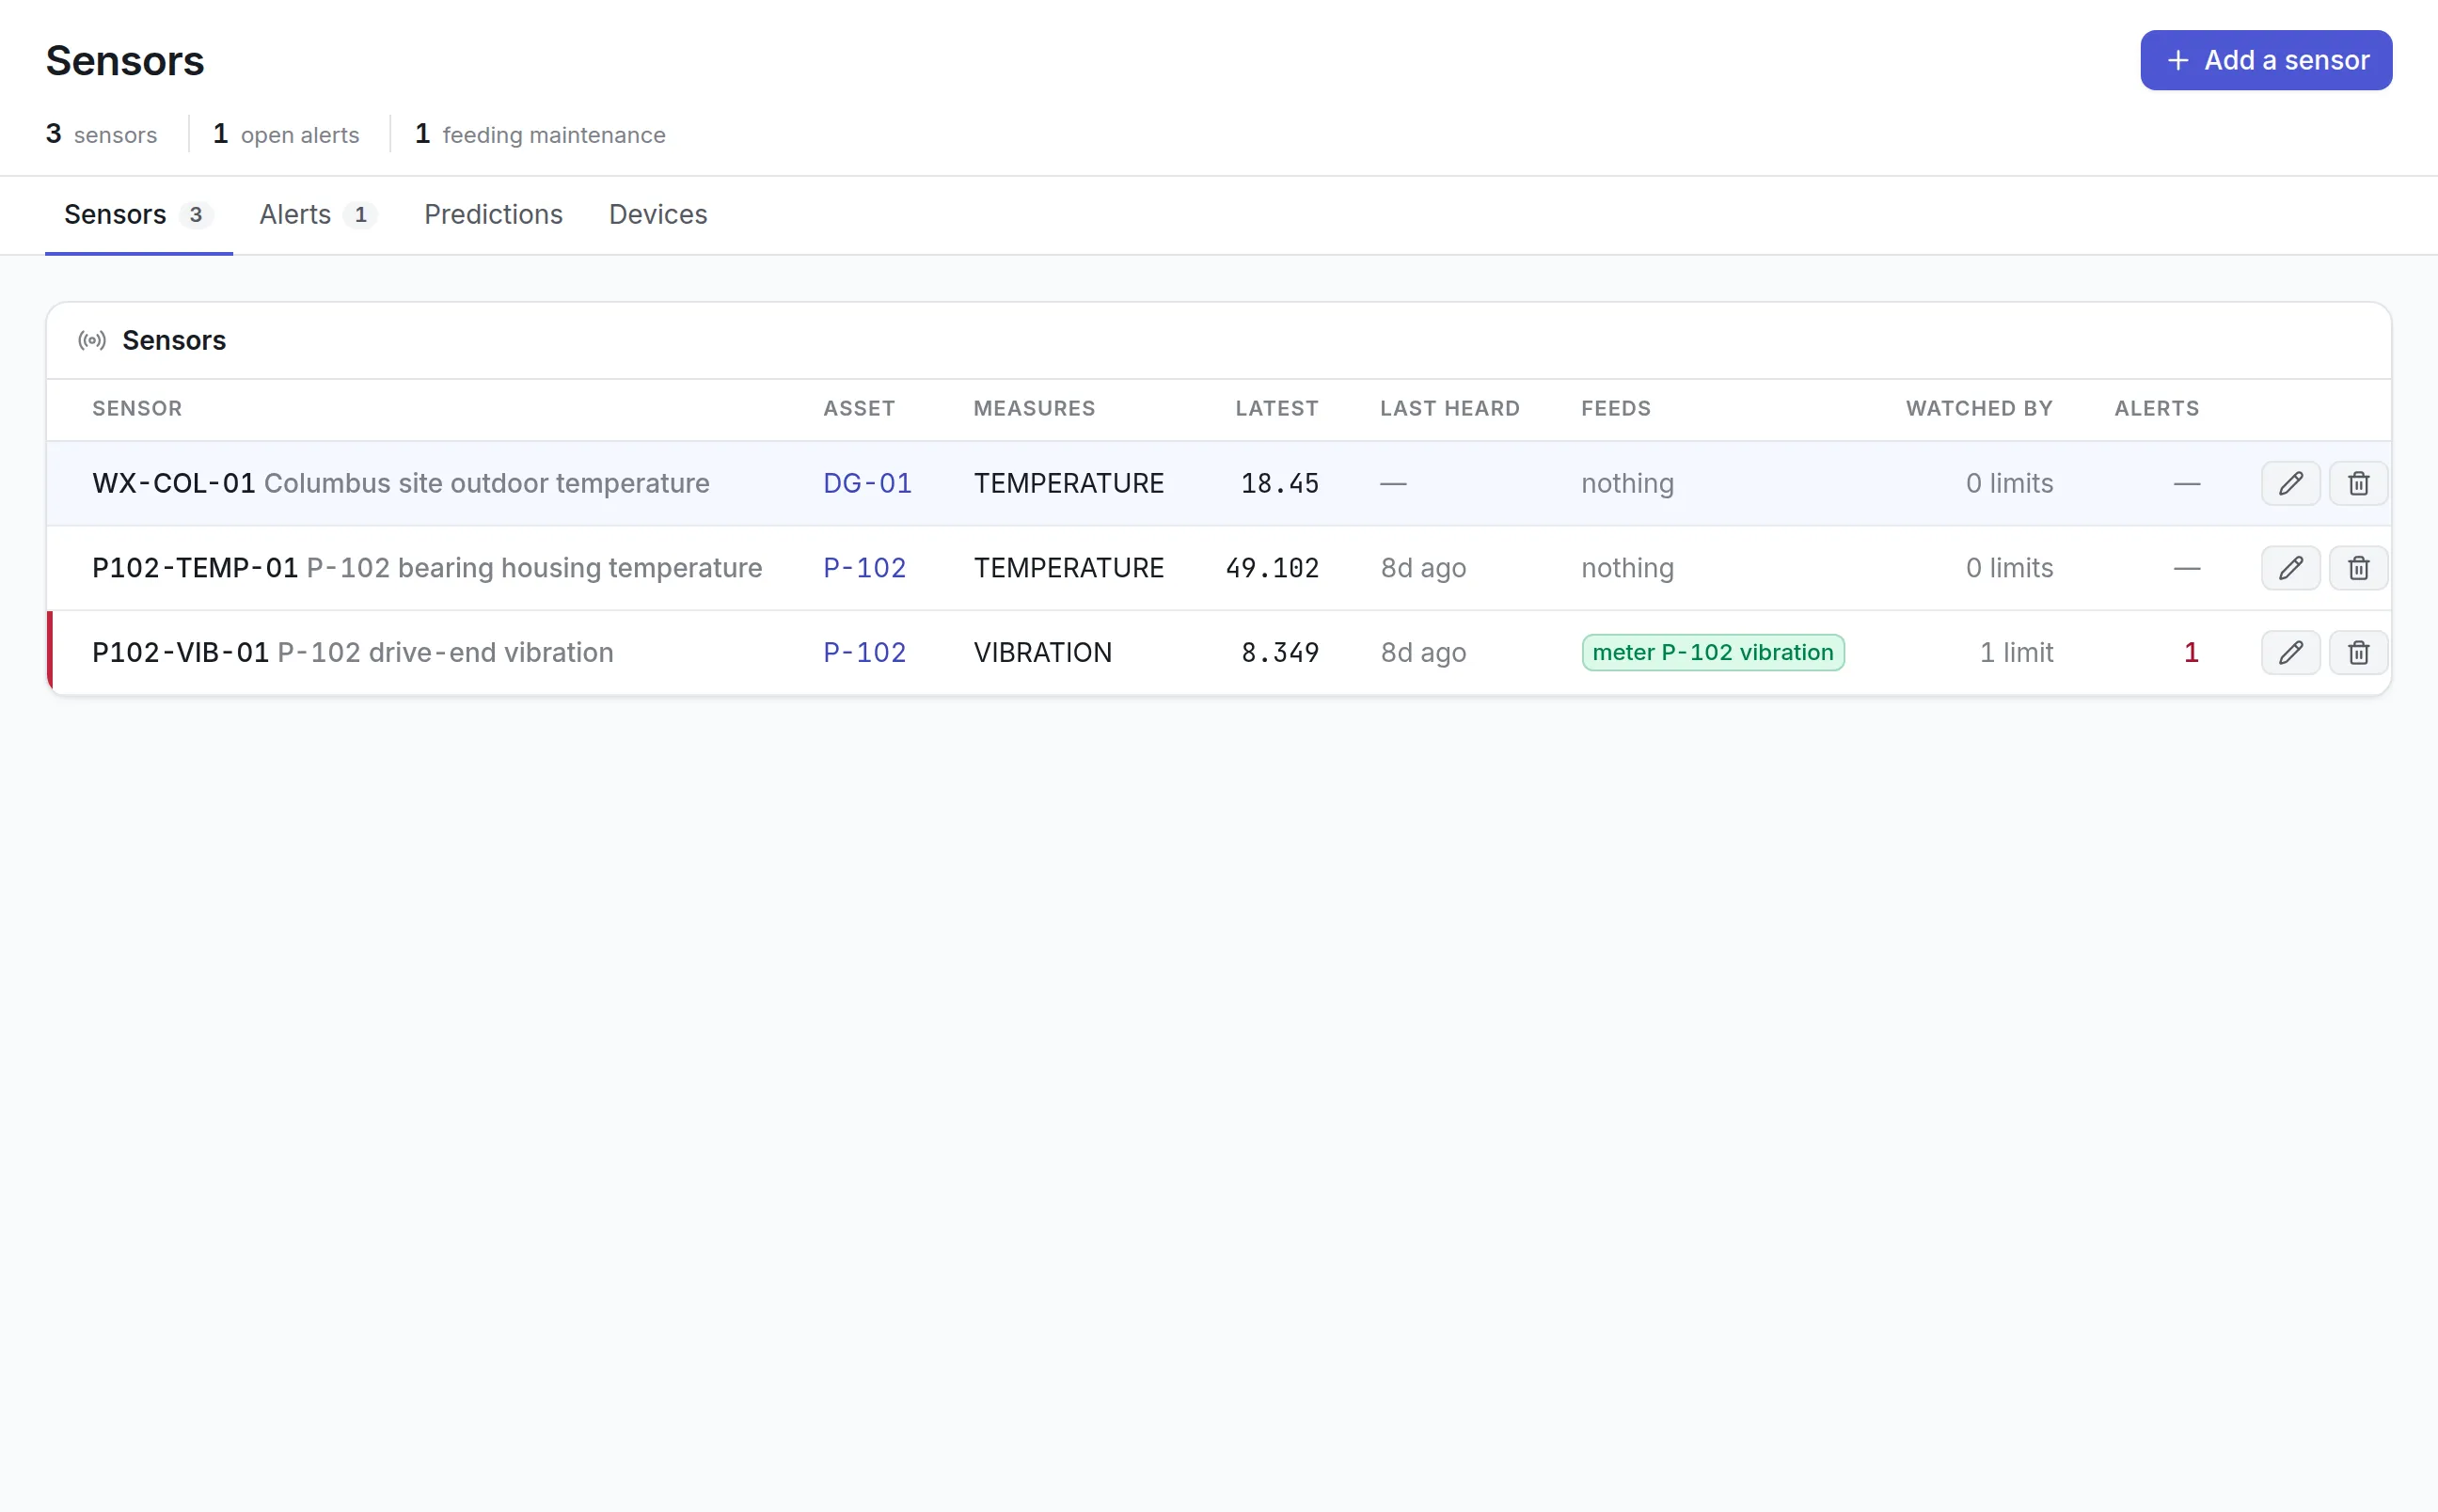
There are two comparisons, and each finding is labeled with the one it came from. Changed compares a supply point with its own history: the same period last year, adjusted for weather where a weather source is set, or the average of earlier periods. Worse than its peers compares it with the median of comparable supply points over the same period, which works from the first month before any history exists.
More detail
Findings are ranked advisory, important or urgent. Urgent means more than half as much again as expected, which is usually a damper stuck open, a schedule that was overridden or a leak. When a supply point is set to raise work, the finding becomes a work order for your preventive maintenance software team, of a type you choose.
Readings that survive real meters
Utility data is messy, and the product is honest about what it cannot see:
Weather, carbon and maintenance on the same numbers
A supply point can be marked as driven by heating or cooling. With an outdoor temperature sensor set as the site’s weather source, consumption is compared on degree days, so a cold January is not reported as a fault. Every reading also carries kilograms of CO2e from the emission factor in force when it was taken, dated so a cleaner grid later never restates a year already reported.
Binding a supply point to an asset meter passes its readings to that meter, so usage-based maintenance plans come due by themselves. An asset with a supply point shows an Energy panel on its Costs tab with what it used and what it cost.
What to look for when choosing energy management software
| Capability | Why it matters | In Asset Infinity |
|---|---|---|
| Metering at asset level | Waste hides in one machine, not in the site total | Supply points narrowed to a single asset |
| Peer comparison | New sites have no history to compare with | Median of comparable supply points |
| Weather normalization | Cold months look like faults otherwise | Degree days from a site sensor |
| Honest gaps | An unread meter is not zero use | Not read recently banner and estimate handling |
| Findings that become work | A chart nobody acts on saves nothing | Optional work order per supply point |
| Cost and carbon | Finance and sustainability need the same data | Dated tariffs and emission factors |
| Reduction targets | Commitments need tracking | Targets paced against the baseline period |
See it on your own assets, or price it in two minutes.
Energy management software by industry
Facility management
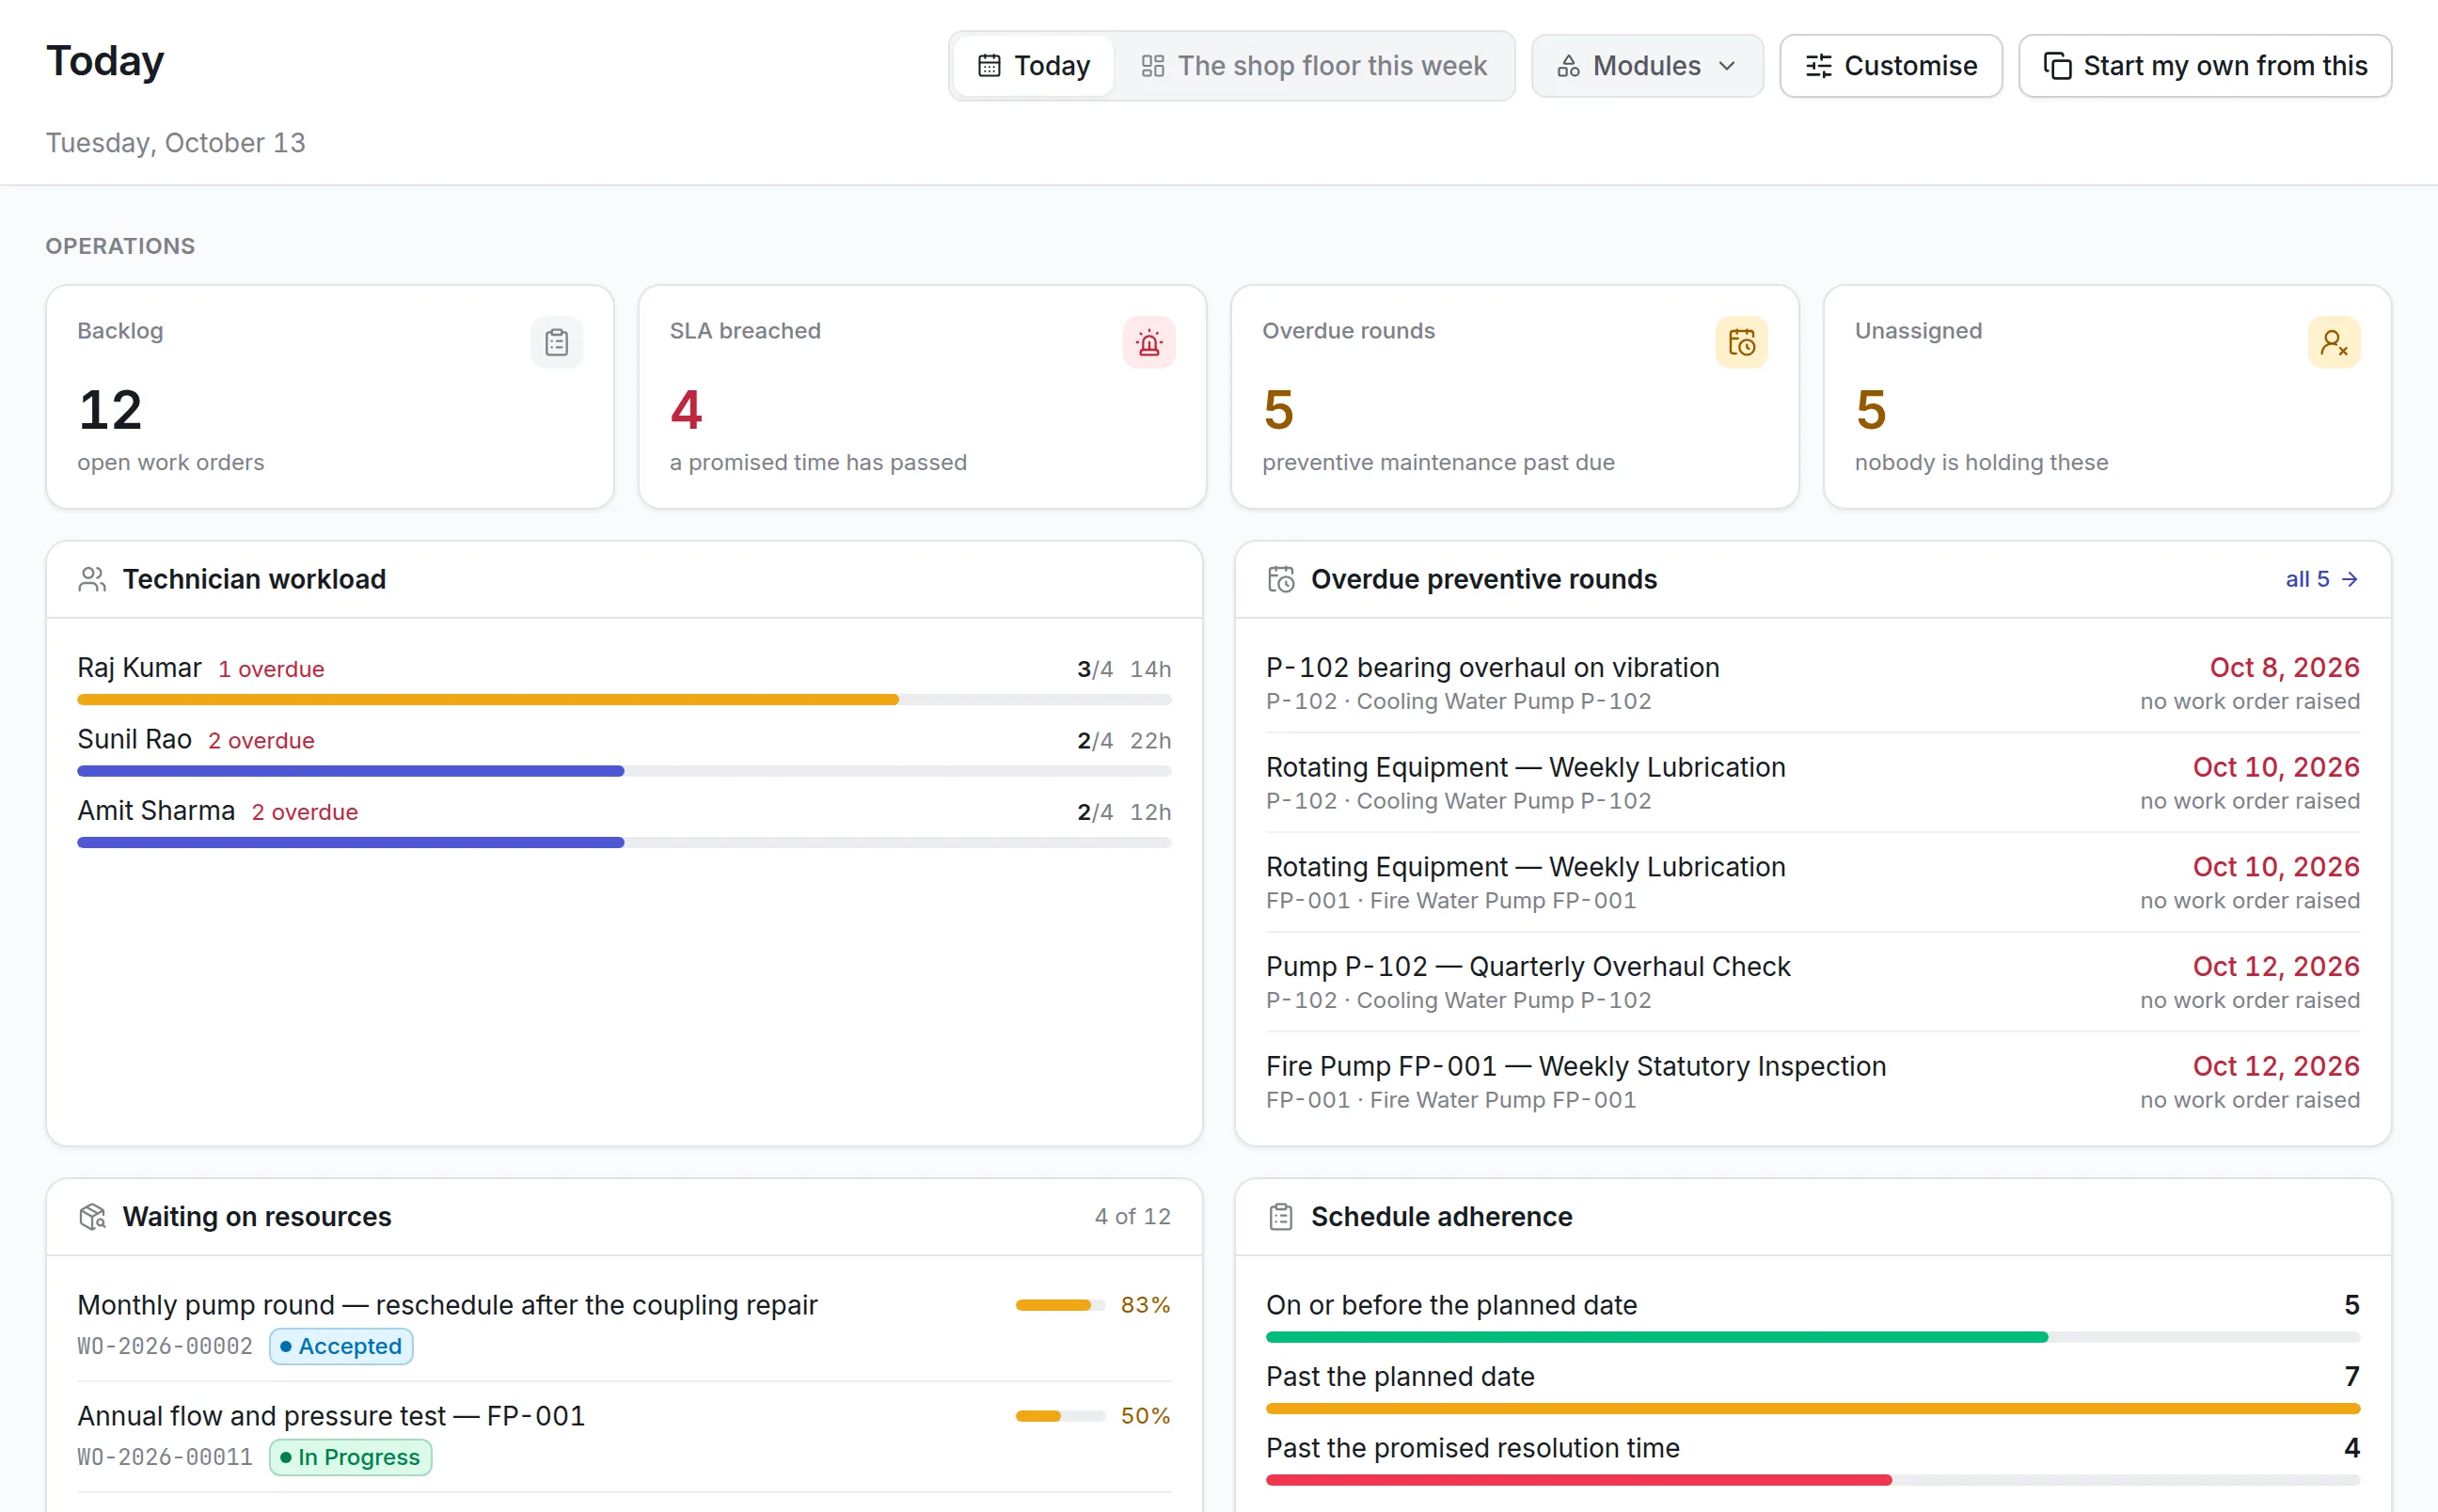
Each building’s incoming main is a billed supply point, with submeters on air handlers and chillers. Peer comparison finds the one unit using twice what its neighbors use, and the finding becomes a job for the technician who looks after it. Monthly utility cost by site lands in the same reports as maintenance cost. See facility management software.
Hotels and resorts
Water and gas are metered per building and per kitchen, and pool heating and guest-room cooling are compared with the weather taken out. Bills are transcribed with their amounts, so the cost figure is what the utility actually charged. Read more on hotel maintenance software.
Manufacturing plants
Submeters on production cells and air compressors are bound to asset meters, so usage-based plans and energy findings run on the same readings. Generator diesel is recorded as delivered and dipped rather than as a climbing dial. Related: maintenance software for manufacturing.
Campuses and portfolios
A campus meters each hall and lab building. Site-wide targets sum only billed supply points, so the same energy is never counted twice when buildings report against a reduction commitment, and each target says whether it is ahead, on track, behind or missed. See school and university maintenance software.
Getting started with energy management software
Most teams begin with the bills they already receive. Add each billed supply point with its current reading as the base, import past readings from the bills in bulk so the baselines have history, and set the tariff and emission factor with its source. Then add submeters on the largest loads, name a weather source for heating and cooling plants, and switch on work orders for the supply points a technician can actually fix. Where meters also feed equipment monitoring, the same readings support predictive maintenance software.
Energy management software pricing
Asset Infinity starts with the asset register at $130 a month for up to 500 assets, with unlimited users. Energy and utilities is a $150 monthly add-on for the whole organization. Build a quote, and see consumption and cost reports beside your other figures in maintenance reporting.
More in Account
Common questions
What is energy management software?
Energy management software records how much electricity, gas, water and fuel a business uses, where and at what cost. It helps find waste, compare sites and track progress against targets.
Can it show consumption by asset as well as by site?
Yes. A supply point can meter a whole site or building, or a single asset such as an air handling unit, and consumption is reported at each level. An asset's Costs tab shows what it used, what it cost and its carbon over the last year.
How does it decide a reading is a problem?
It compares each period with the supply point's own baseline and with comparable supply points over the same period. A gap of more than half again what was expected is ranked urgent, because it is usually a fault such as something left running or a failed control.
Do we need smart meters?
No. Readings can be typed in from a utility bill or a dial, or taken on the mobile app's meter-reading round, which works offline. Readings can also arrive from sensors or be imported in bulk.
Can it raise a work order when consumption jumps?
Yes. A supply point can be set to raise a work order of a chosen type when it has an abnormal period. It raises one at a time, so another anomaly waits until that job is closed.
Does it track carbon emissions?
Yes. Each reading carries a carbon figure in kilograms of CO2e from the emission factor in force when it was taken, with the factor's published source recorded.
See it with your own assets
A demo run on an example from your industry. Or start the trial and look around on your own.