

A maintenance KPI dashboard for every role, with reports that arrive on their own
A maintenance KPI dashboard for every role, plus boards you build from widgets. Saved reports run on demand or land in inboxes daily, weekly or monthly as PDF, Excel or CSV.
What our maintenance KPI dashboard and reports give you
The KPIs that matter
The organization's figures show MTBF, MTTR, availability and PM compliance from the reliability engine, beside cost and the work that is open and overdue.
Boards for every role
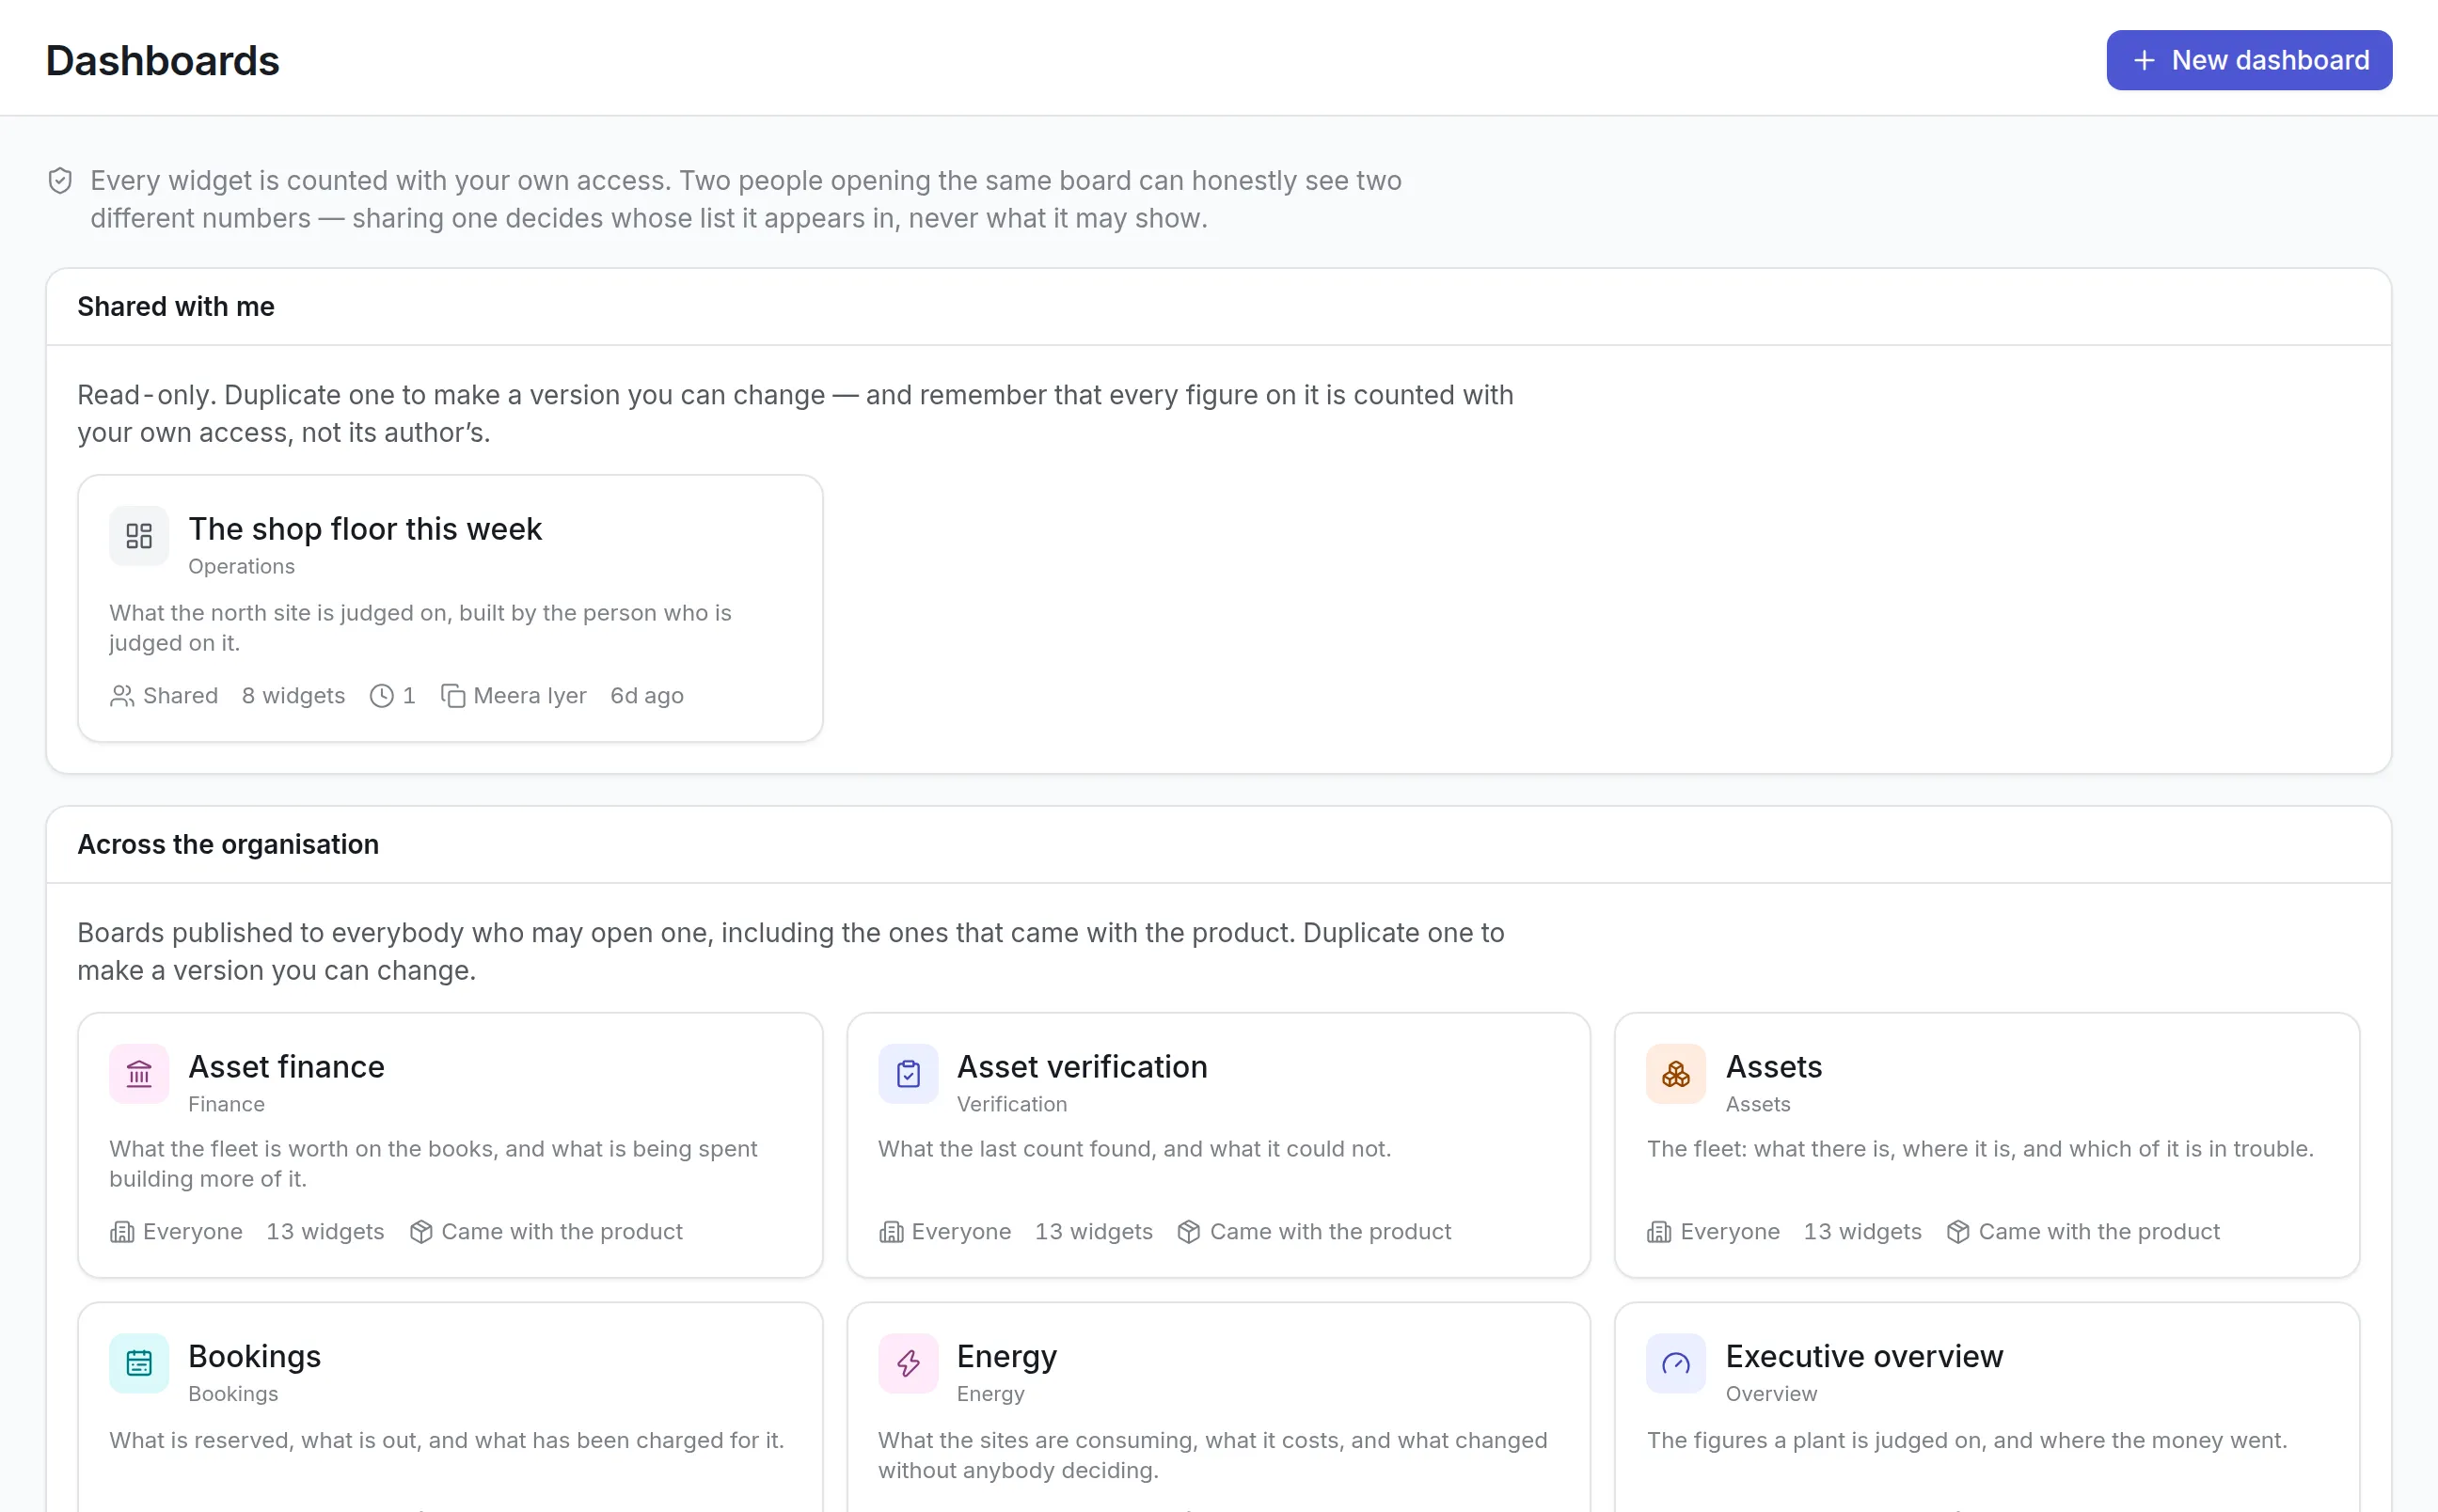
Today assembles your own work, operations and the organization's figures from what your role can read, and ready-made boards cover each module. Duplicate one to make it your own.
Build from widgets
Numbers, rankings, proportions, bars over time, trends, tables and pivots, counted, summed or averaged, by day, week, month, quarter or year.
Saved reports
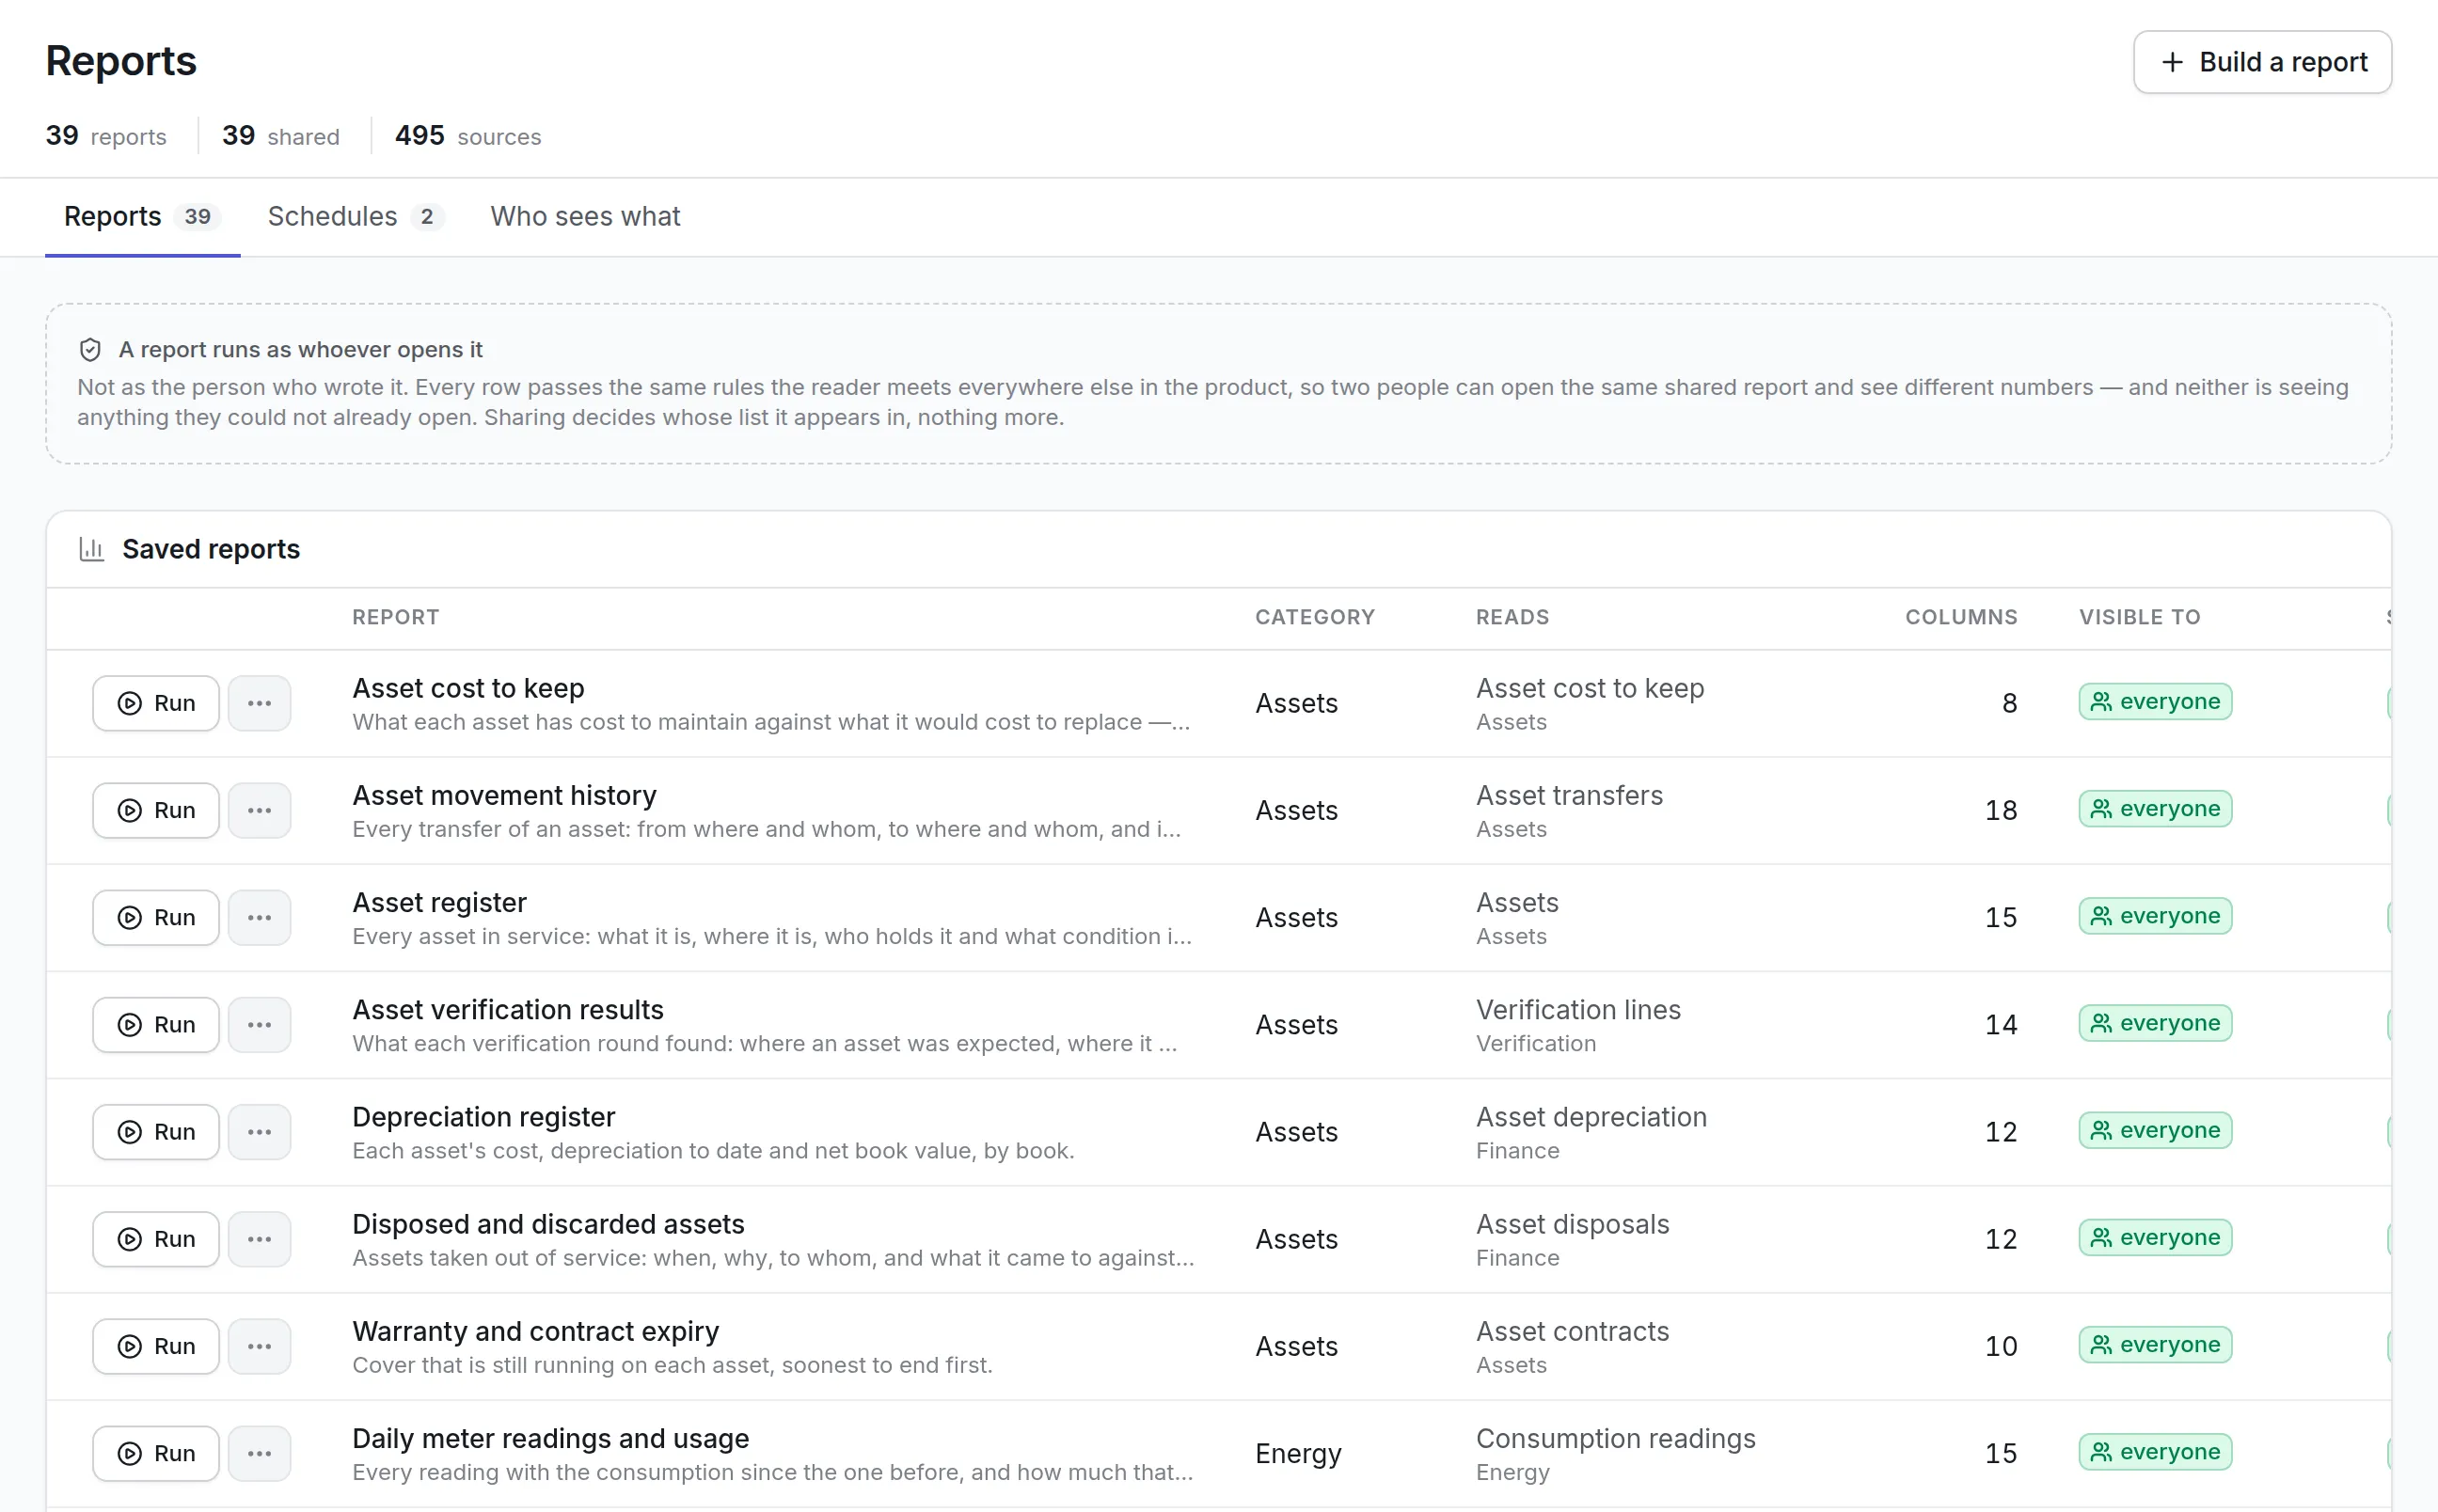
A pack of 78 reports ships ready to run, from the asset register to PM compliance, contract expiry and meter readings. Build your own with the report builder.
Scheduled and emailed
Reports go out daily, weekly or monthly as CSV, Excel or PDF, with the chart included. Dashboards can be sent as PDF or Excel on a schedule too.
Numbers that respect access
A shared report or board runs with the reader's own access. Two people can open the same board and each sees only what they are allowed to.
What is a maintenance KPI dashboard?
A maintenance KPI dashboard is a screen that shows the measures a maintenance team is judged on, such as backlog, overdue preventive maintenance, PM compliance, MTBF, MTTR, availability and maintenance cost, counted from the work orders and asset history the team already records. It tells a manager at a glance whether maintenance is keeping up.
The questions are the same every week: what is open, what is overdue, what broke its response time and where the money went. A dashboard that answers them from live records replaces the spreadsheet someone rebuilds every Monday morning.
How the maintenance KPI dashboard works in Asset Infinity
There are three layers, and each one counts every figure with the reader’s own site access and permissions. That makes it safe to share a board widely, because nobody sees a number they could not already open elsewhere.
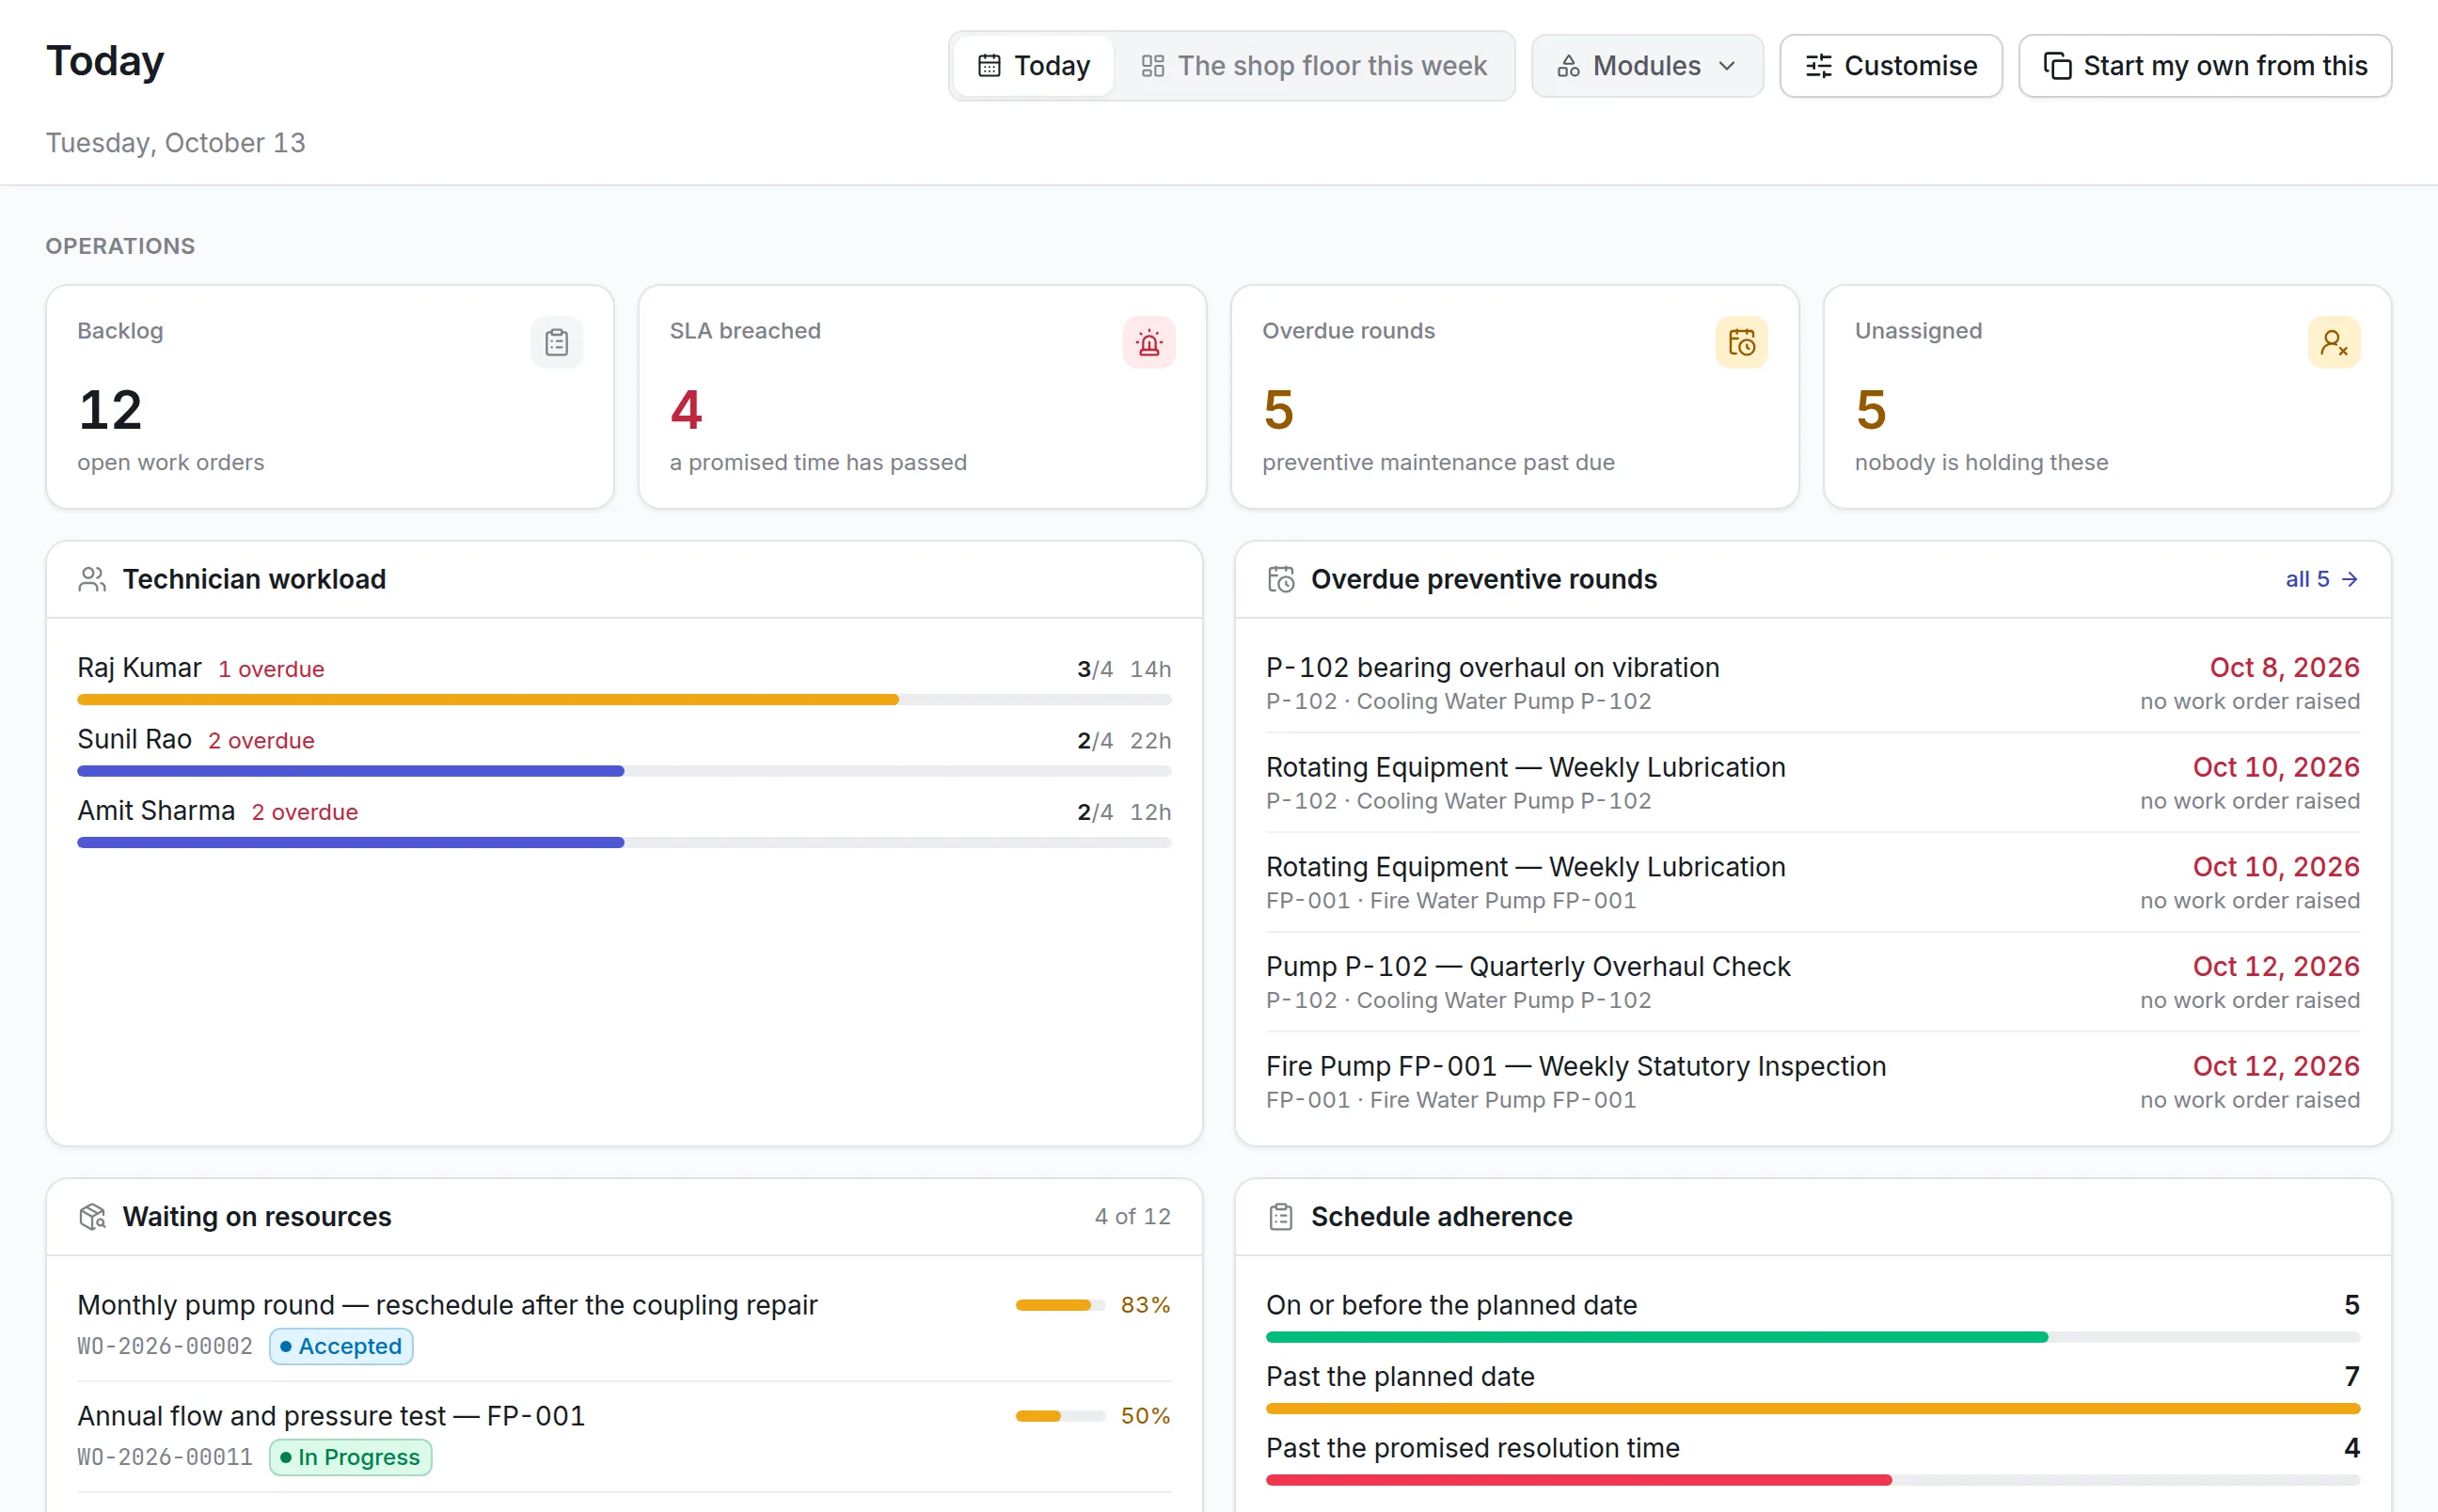
- Today, built for you.The home screen assembles up to three bands from the modules your organization has and your roles can read: your own work, operations, and the organization’s figures. A role your organization invented gets the right sections without anyone configuring it.
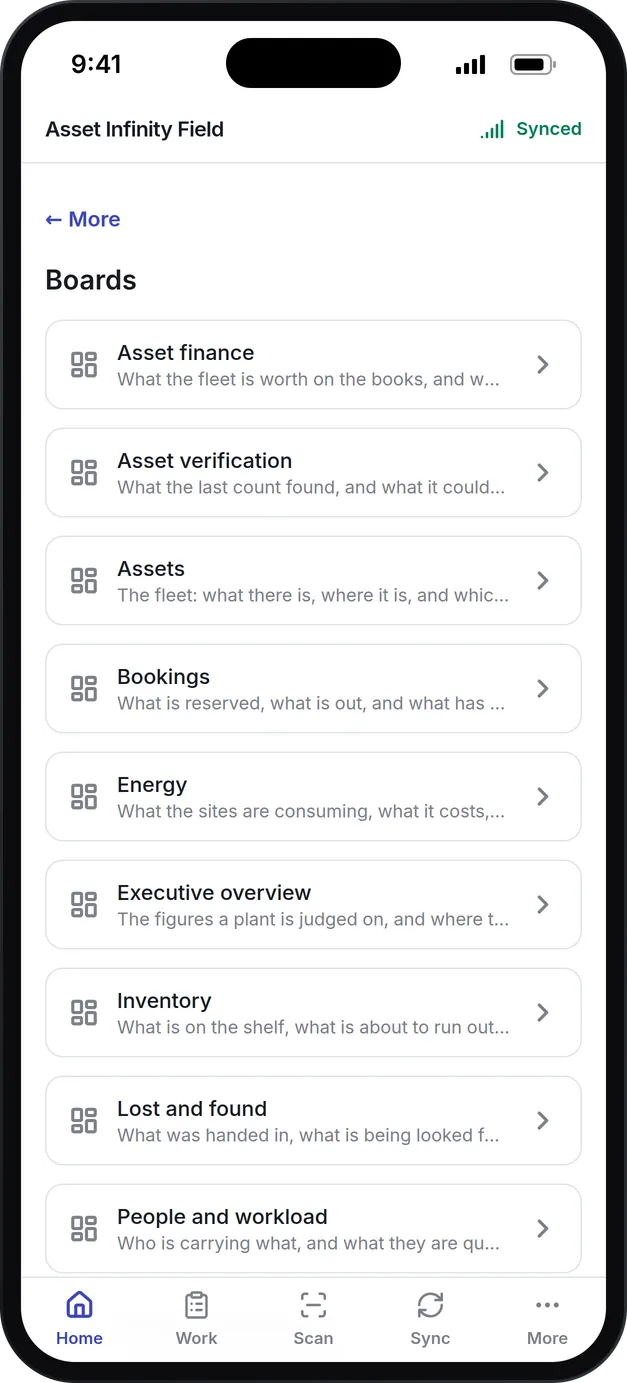
- Module boards, ready made.Sixteen boards cover areas such as work orders, planned maintenance, reliability, inventory, purchasing, people and workload, energy, and vendors and contracts.
- Boards you build.Any board can be duplicated and changed, or you can start one from blank and add widgets.
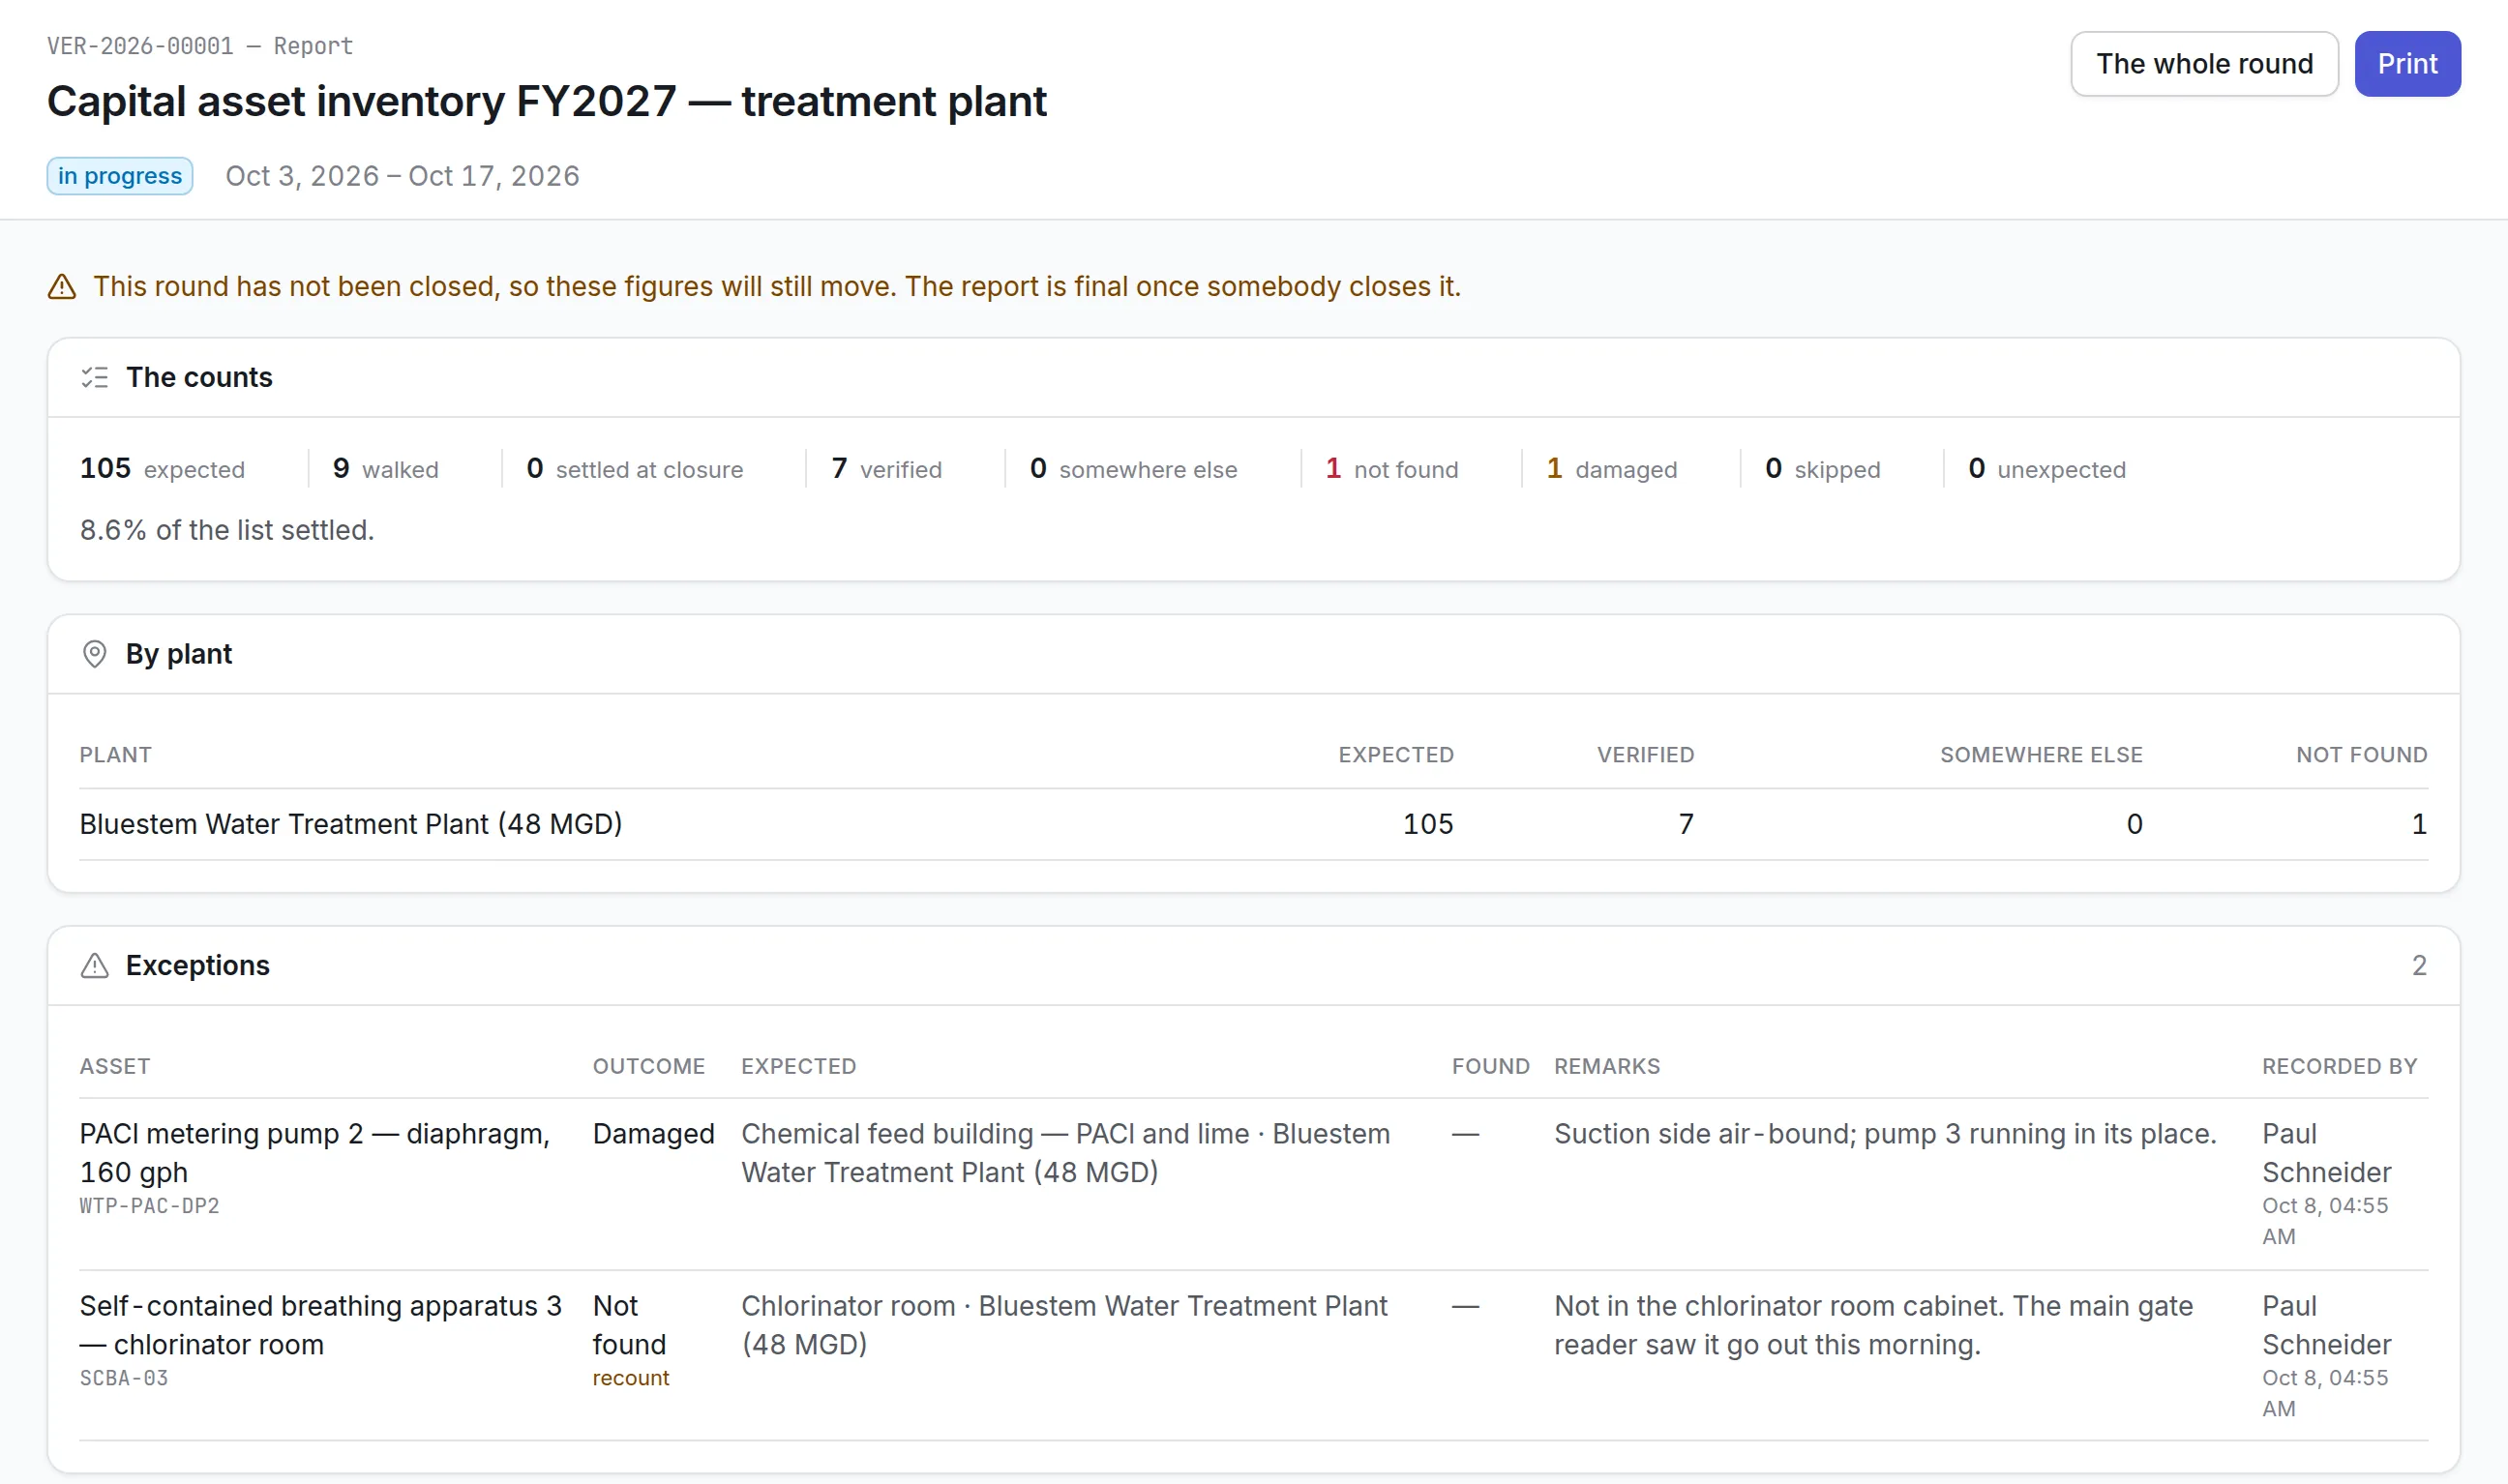
- Reports behind the figures.Click a tile or a bar to see the rows behind it, or open the saved report that answers the same question in full.
The maintenance KPIs on the board
| KPI | What it tells you | Where it appears |
|---|---|---|
| Backlog | Open work orders waiting to be done | Operations band, work order boards |
| SLA breached | Jobs past their promised response or resolution time | Operations band, performance reports |
| Overdue preventive rounds | PM past due, including rounds with no work order raised | Operations band, planned maintenance board |
| Schedule adherence | Open work on time, past its planned date or past its promised resolution | Operations band |
| PM compliance | Share of planned work done on time over a period | Organization figures, compliance reports |
| MTBF | Average operating time between failures | Organization figures, reliability screen |
| MTTR | Average time to repair | Organization figures, reliability screen |
| Availability | Share of time assets were not in a downtime status | Organization figures, reliability screen |
| Planned against reactive | How much work was planned versus breakdowns | Organization figures, monthly reports |
| Maintenance cost | Labor, parts and vendor cost by site, month or asset | Cost reports, cost against budget |
See it on your own assets, or price it in two minutes.
Reliability figures from one engine
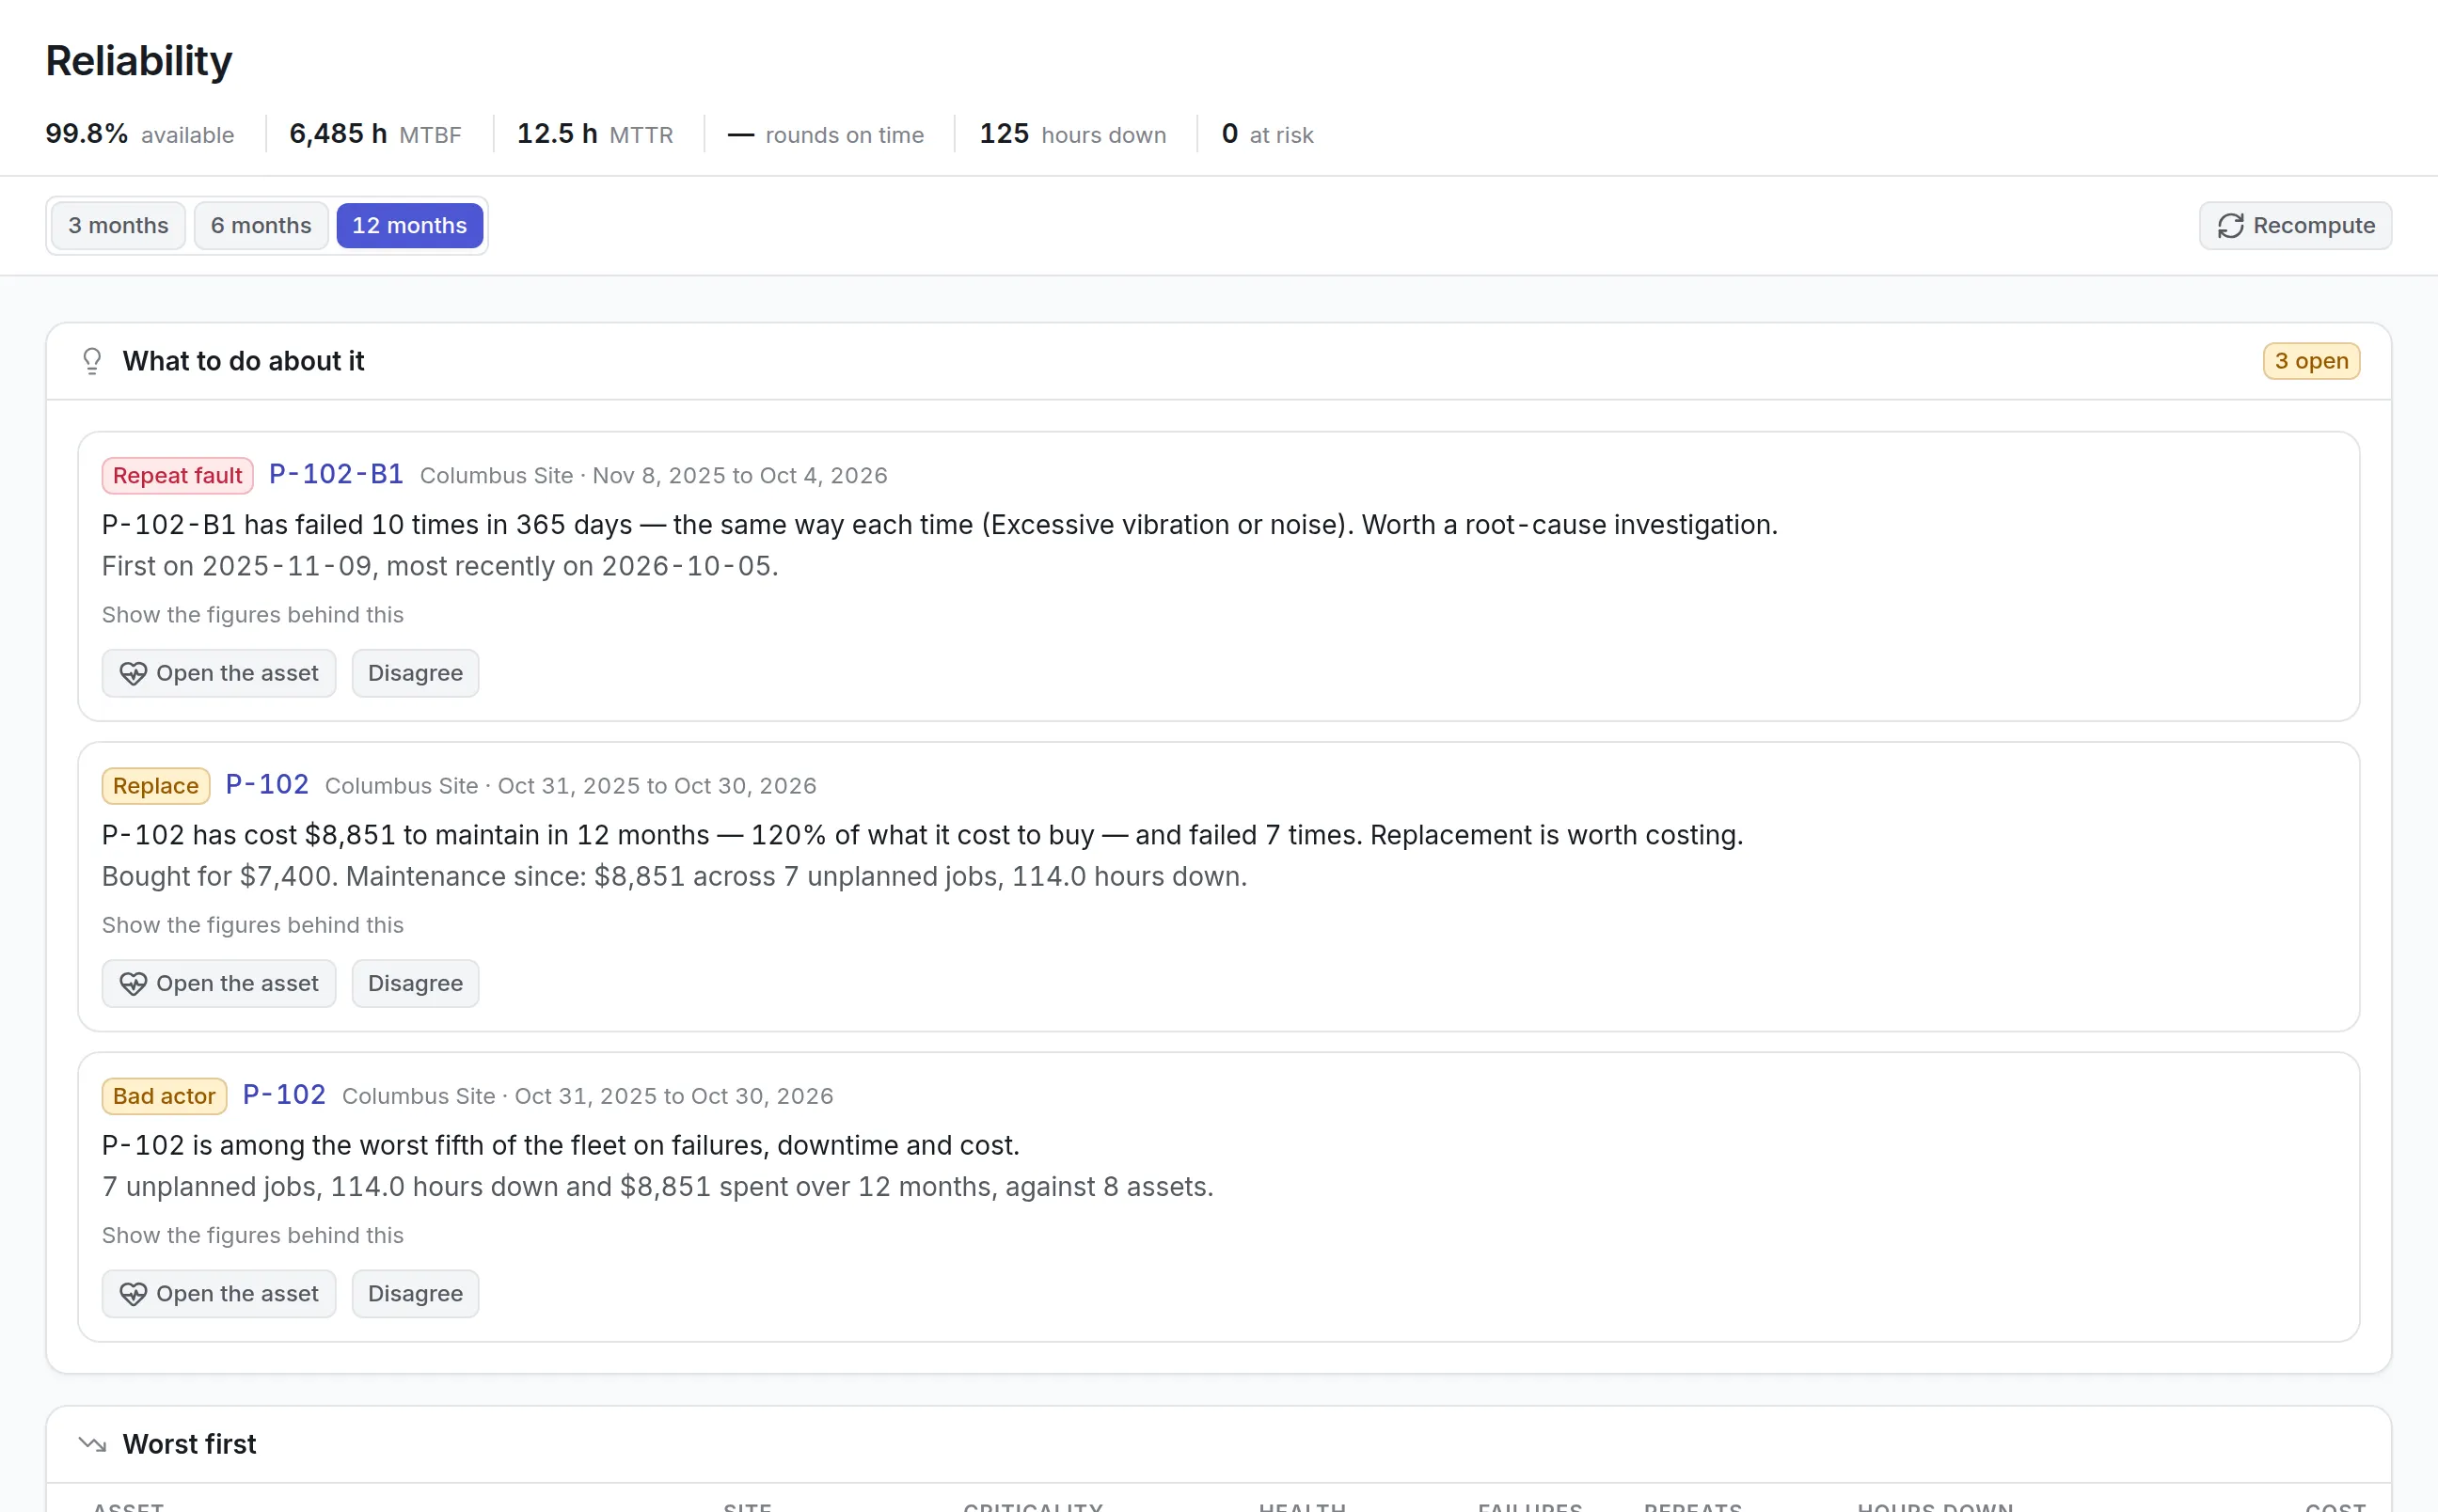
MTBF, MTTR, availability and PM compliance are worked out nightly by the reliability engine from closed work and asset status history. Because they are computed once, the number in a board pack matches the number on the root cause analysis software screen. A figure that cannot be computed yet shows a dash instead of an estimate, and MTBF needs at least two failures before it says anything.
More detail
The same screen lists bad actors, the assets in the worst fifth of the fleet on failures, downtime and cost, and repeat faults worth an investigation. Downtime by month turns red in a month with an emergency.
Building your own board
A board is a twelve-column grid that reads correctly on a laptop, a phone and a printed page. Each widget answers one question, and the editor asks for it in order: what kind of widget, what it reads, what it counts and how it reads.
Saved reports and the report builder
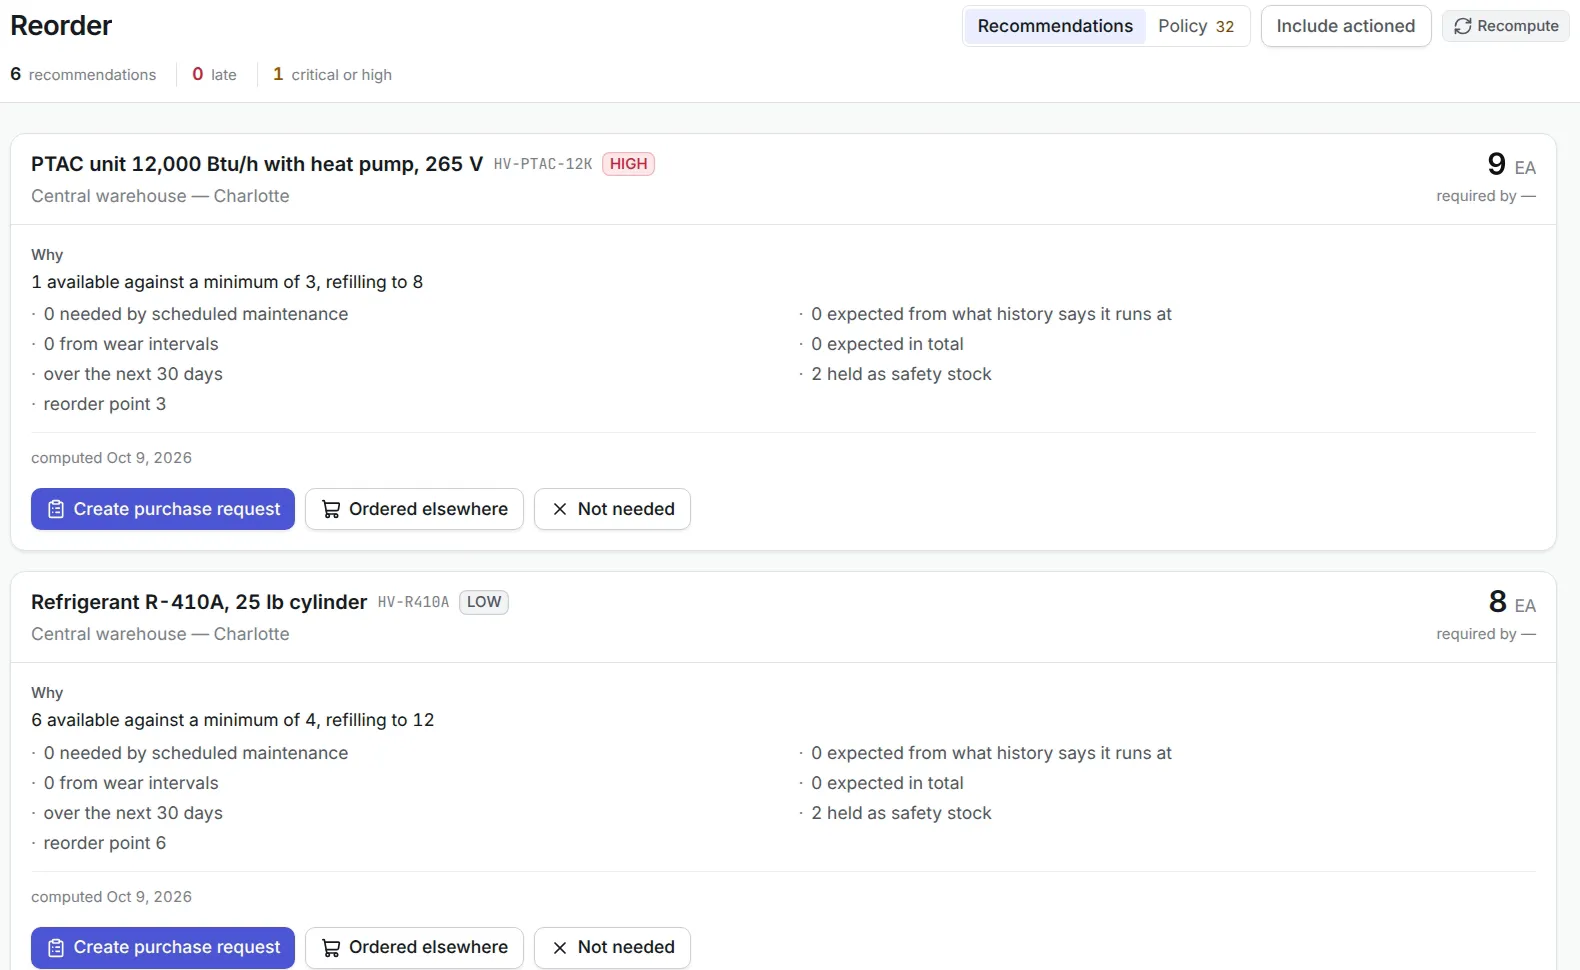
A new organization starts with 78 reports, so the common questions are answered before anyone builds anything. Maintenance reports include monthly planned maintenance and compliance, overdue planned maintenance, PM compliance by site, open work order ageing, planned versus reactive work, repeated problems, maintenance cost by site, technician performance and vendor performance.
More detail
The report builder returns either a list of rows or counts and totals grouped like a pivot table, with filters, a date range readers can change, and a chart. A report runs as whoever opens it. A scheduled report runs with its author’s access, because nobody is reading it at that moment, and the email says whose access it was counted with. Work order history behind these figures comes from your work order software, and meter and cost figures from energy management software.
What to look for in a maintenance KPI dashboard
| Capability | Why it matters | In Asset Infinity |
|---|---|---|
| Figures from live records | A rebuilt spreadsheet is out of date by Tuesday | Counted from work orders, assets and stock |
| One source for reliability KPIs | Two MTBF figures start an argument | Computed once by the reliability engine |
| Access-aware sharing | Sharing must not leak other sites’ data | Every figure counted with the reader’s access |
| Drill-down to rows | A number nobody can check is not trusted | Click a tile for the records behind it |
| Scheduled delivery | Managers read email, not dashboards | Reports and boards emailed as PDF, Excel or CSV |
| A delivery log | A schedule that stops sending is invisible | What went out, and what was refused and why |
Maintenance KPI dashboards by team
Maintenance managers
The Operations band shows backlog, SLA breaches, overdue rounds and unassigned work, with technician workload against each person’s limit. Waiting on resources shows which jobs are short of parts, tools or skills, and what we rescheduled shows the tool or bay to buy a second of. Overdue rounds link straight to the plans in your preventive maintenance software.
Plant and reliability engineers
Availability, MTBF, MTTR and bad actors over 3, 6 or 12 months, with repeat faults feeding root cause investigations. Failures by mode and failures that have happened before are reports of their own, and asset cost to keep compares what each asset has cost to maintain with what it would cost to replace.
Executives and finance
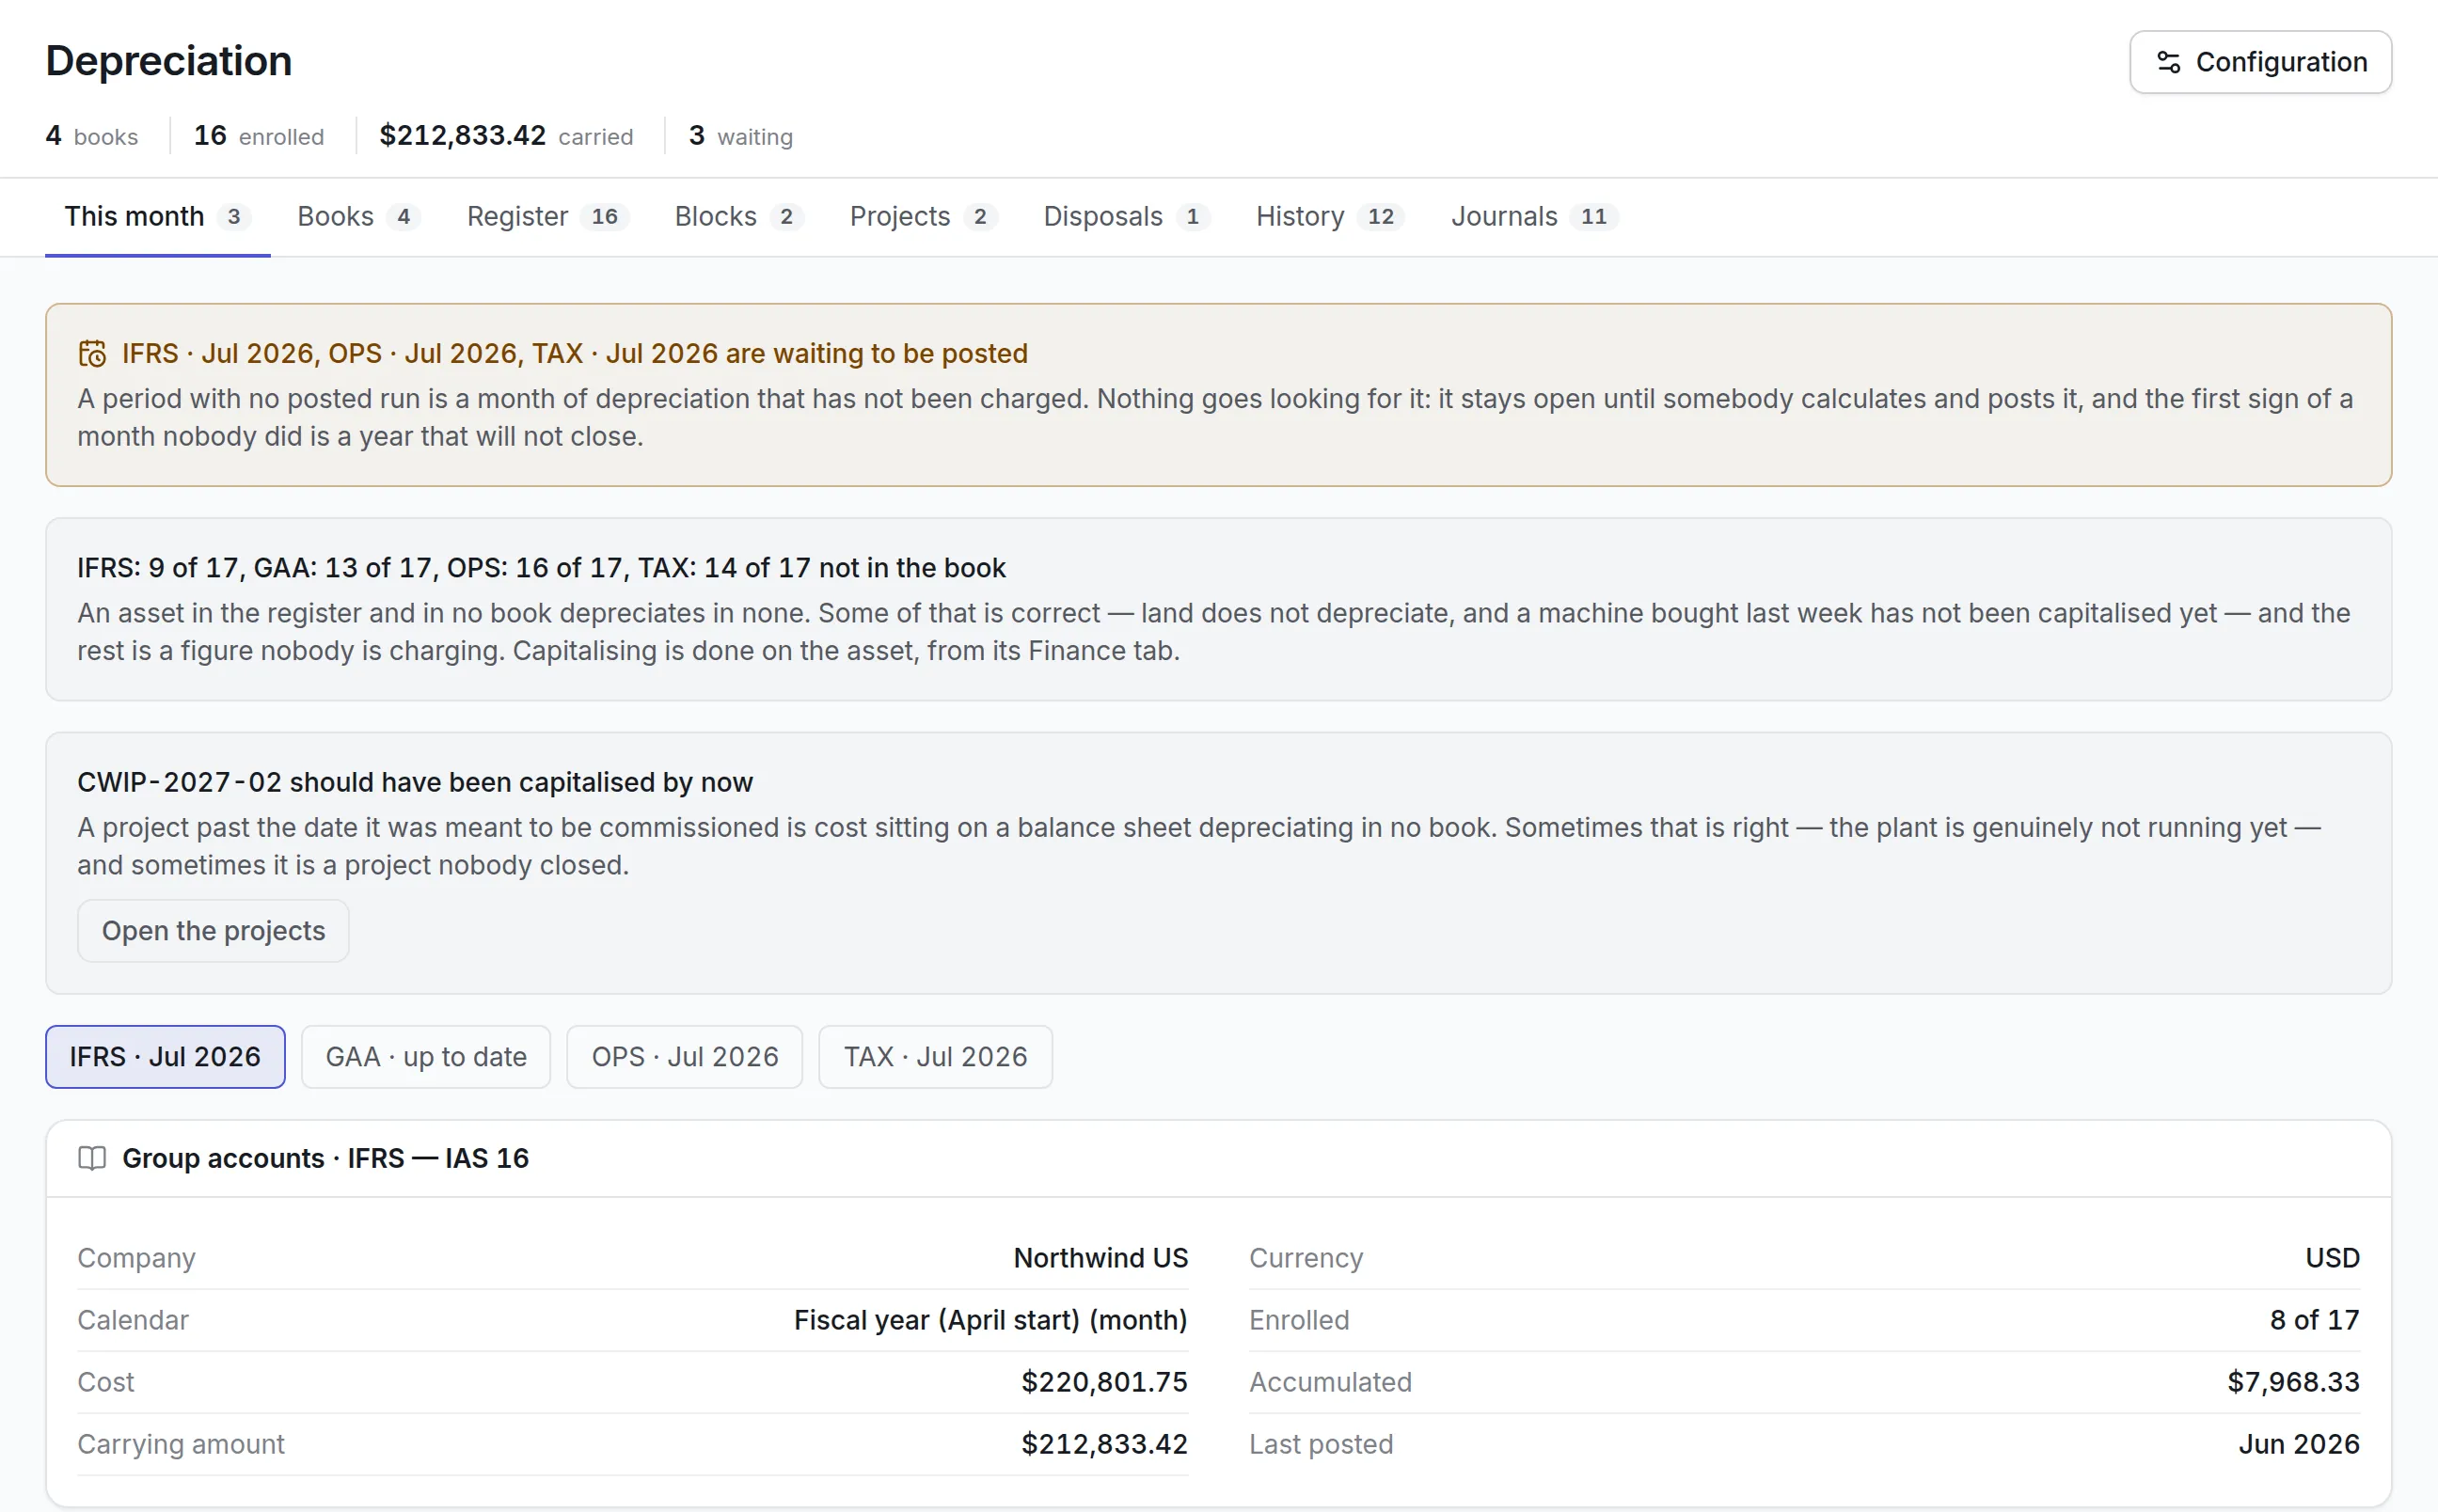
Cost against budget compares each month’s maintenance cost with its share of the year’s budget, and turns amber past 85% and red over it. Maintenance cost by site splits labor, parts and vendors, and purchase spend by vendor shows where the money went. A weekly board pack arrives as a PDF counted with its owner’s access. See fixed asset management software for book value reporting.
Maintenance KPI dashboard pricing
Asset Infinity starts with the asset register at $130 a month for up to 500 assets, with unlimited users. Analytics, which covers reports and the dashboard builder, is $10 per user per month. MTBF, MTTR, availability and PM compliance come from reliability and root cause, a $150 monthly add-on for the whole organization. Build a quote, or read how reporting fits the rest of the CMMS software.
Common questions
What is a maintenance KPI dashboard?
A maintenance KPI dashboard shows the measures a maintenance team is judged on, such as open and overdue work, MTBF, MTTR, availability and PM compliance. It gives managers one place to see whether maintenance is keeping up.
Which maintenance KPIs should we track?
Most teams start with backlog, overdue preventive maintenance, PM compliance, SLA compliance, MTBF, MTTR, availability, planned against reactive work and maintenance cost. Asset Infinity shows each of these on a board or in a report that ships with the product.
How is MTBF calculated?
MTBF is the operating time between failures divided by the number of failures. Asset Infinity works it out nightly from closed work and asset status history, and shows no figure until an asset has at least two failures.
Can we build our own dashboards?
Yes. Start a new board or duplicate one that came with the product, add widgets, and share it with named people, roles or the whole organization.
Can reports be emailed automatically?
Yes. Any published report can be scheduled daily, weekly or monthly to users of your organization as CSV, Excel or PDF. Dashboards can be sent as PDF or Excel.
Will a shared dashboard show people data they should not see?
No. Every figure is counted with the access of the person reading it. Sharing decides whose list a board appears in, never what it may show.
See it with your own assets
A demo run on an example from your industry. Or start the trial and look around on your own.