

Root cause analysis software that finds the failures worth investigating
Root cause analysis software that reads your work order history, measures MTBF, MTTR and availability, and names the assets that keep failing. Open an investigation from there and check later that the fix worked.
What our root cause analysis software does
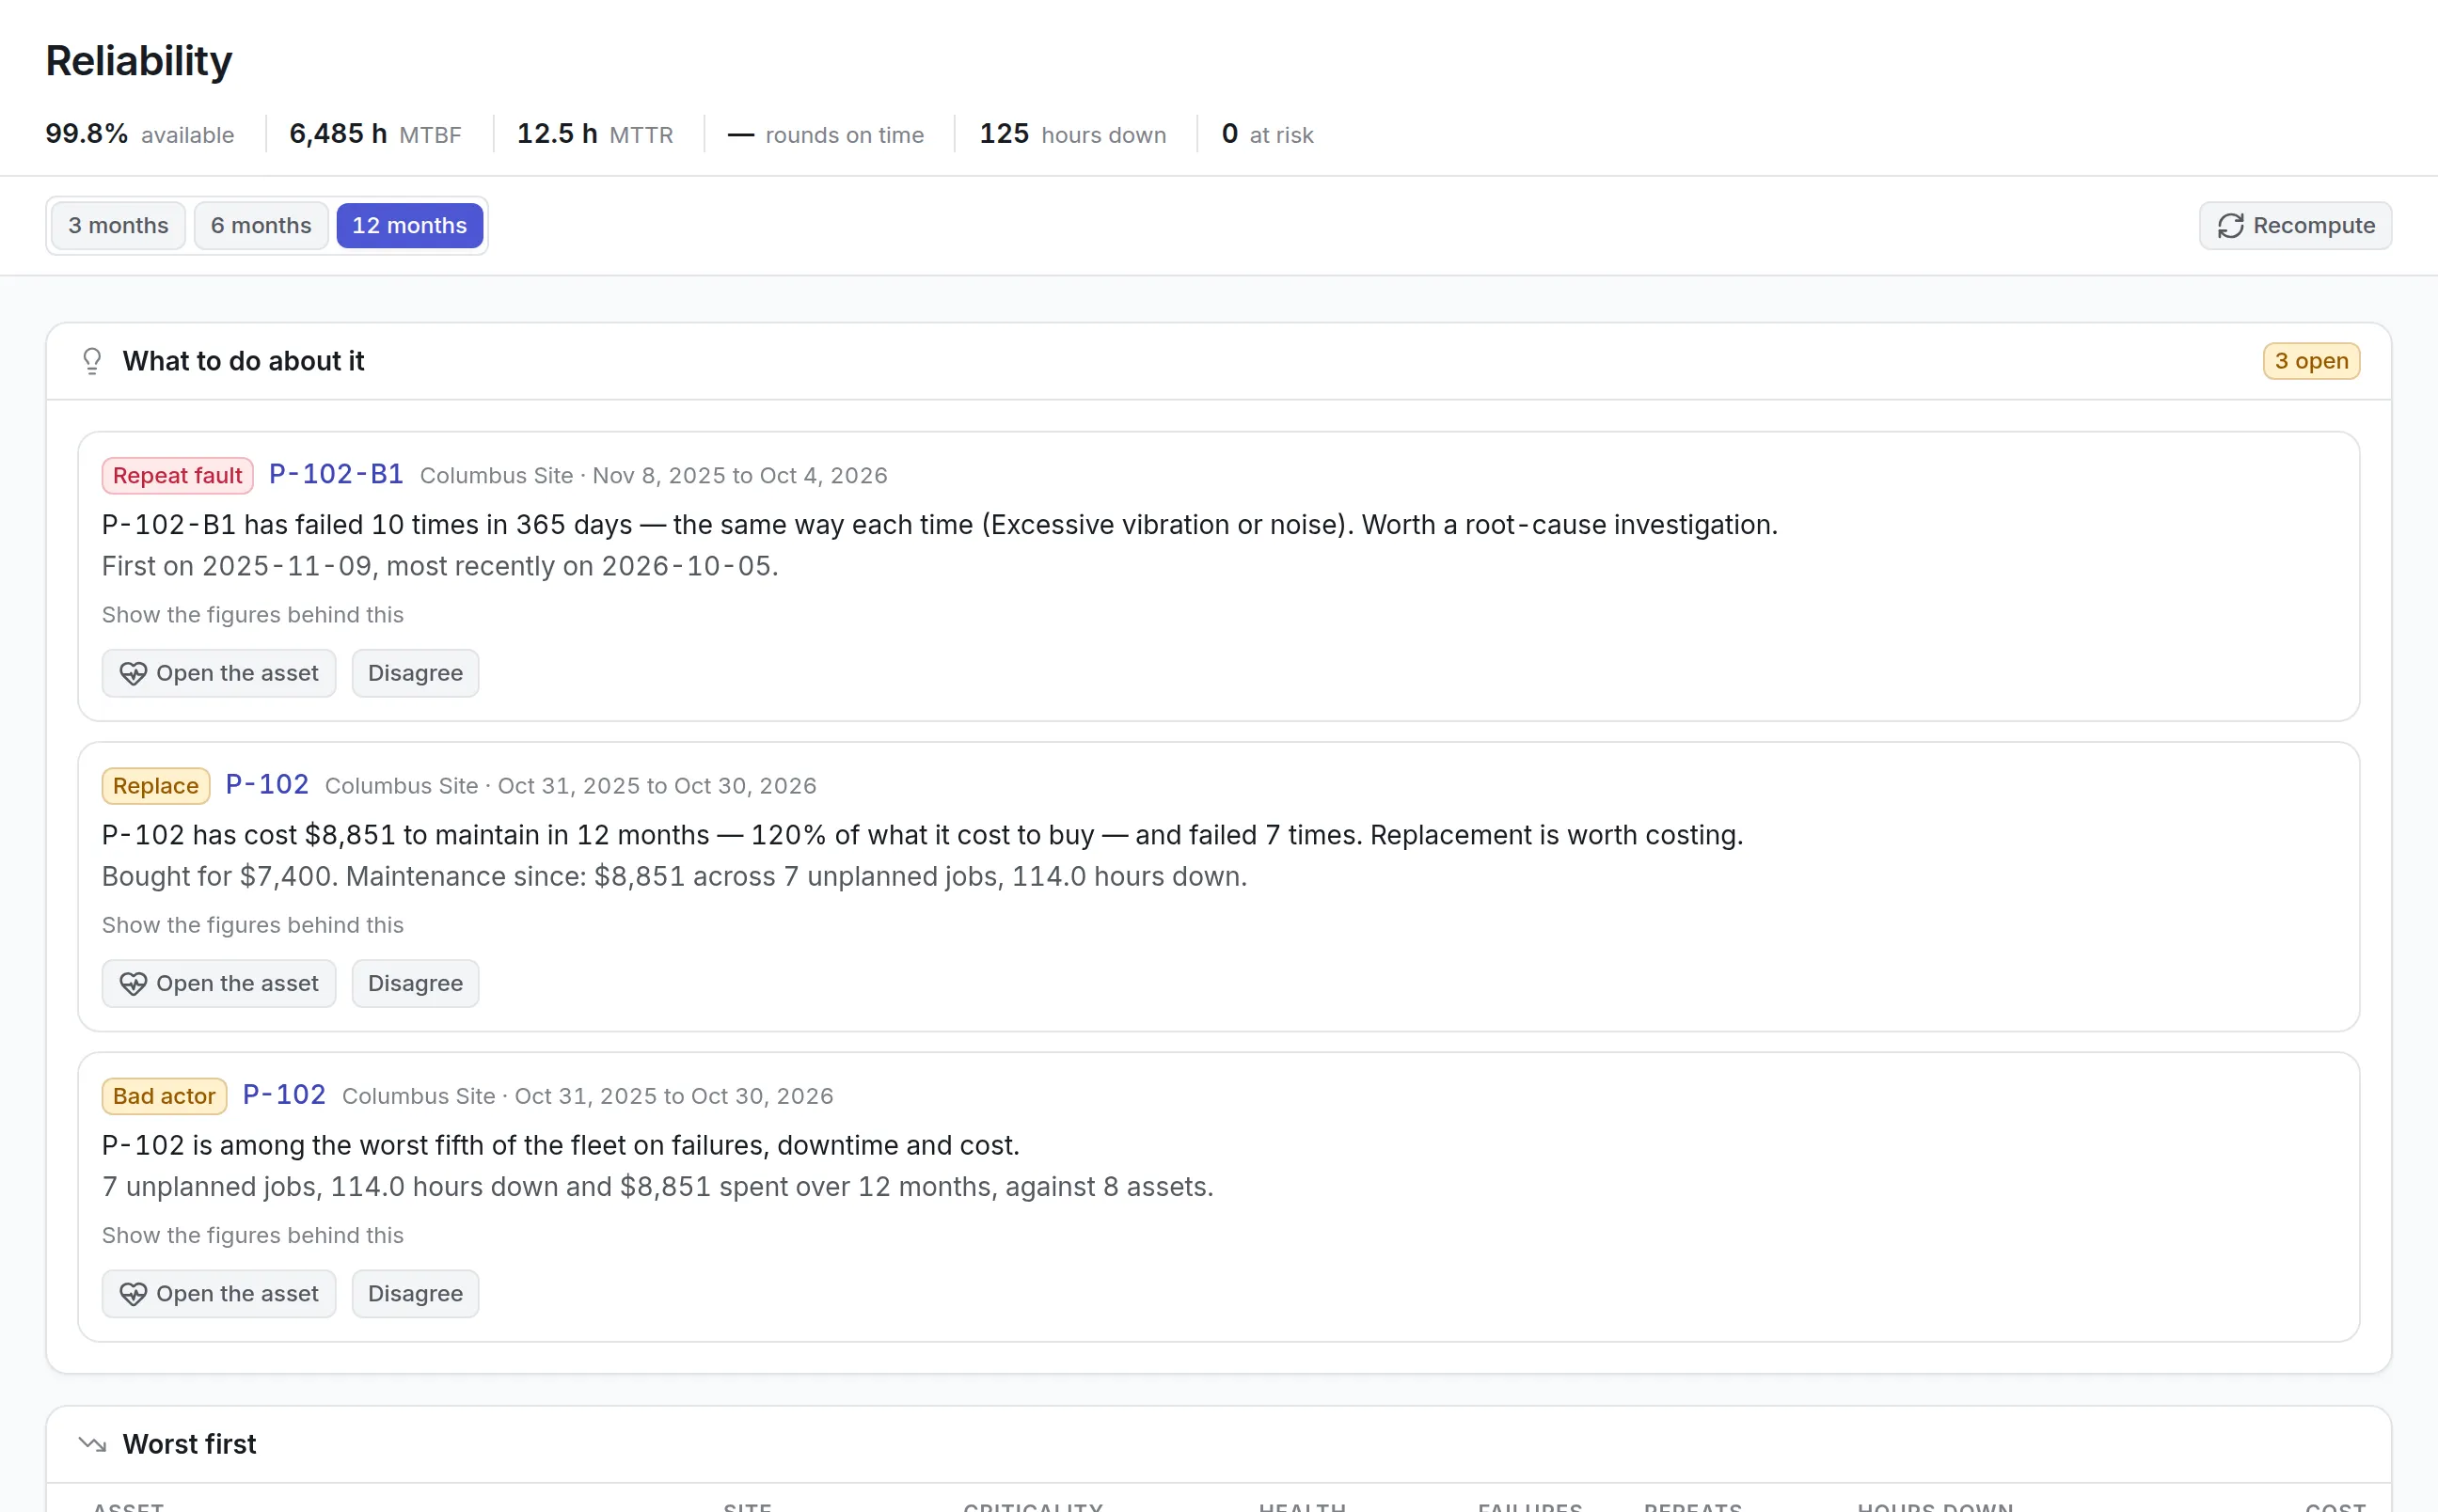
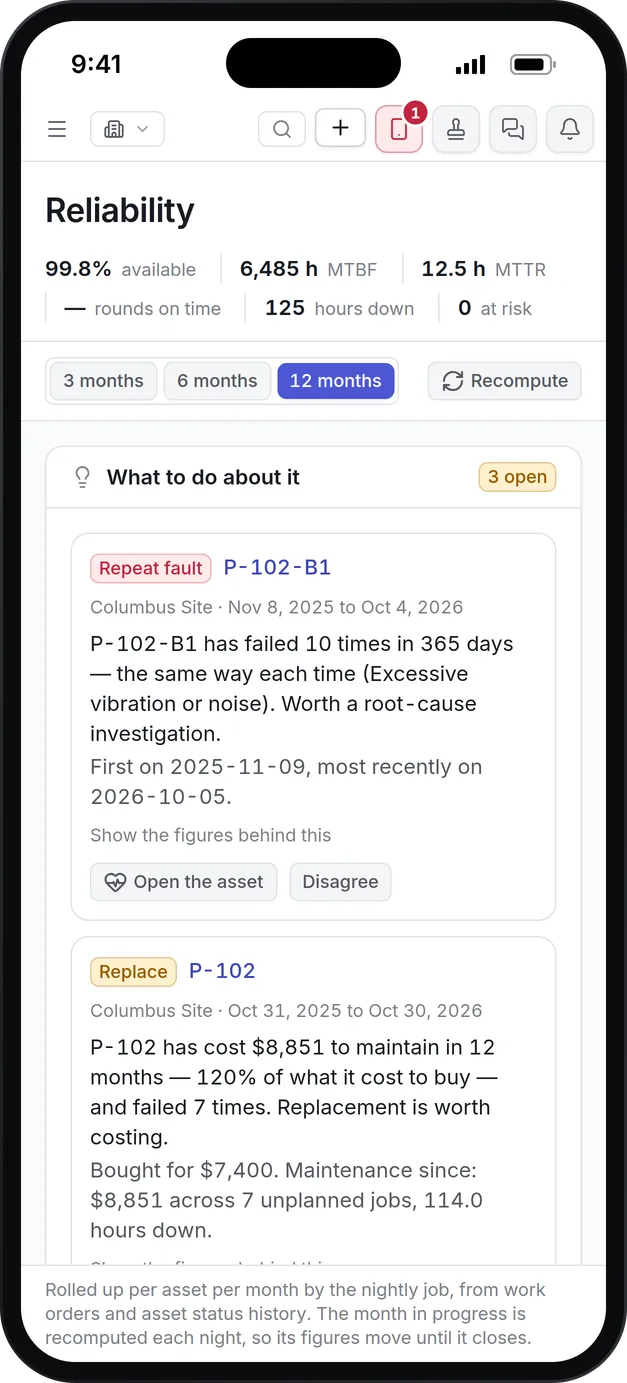
Reliability measured
MTBF, MTTR, availability, hours down and a health score per asset, over 3, 6 or 12 months, computed from work orders and their status history.
Recommendations you can check
Repeat faults, bad actors, assets worth replacing and plans worth reviewing are raised with the figures behind them, and can be dismissed with a reason.
Three investigation methods
Run a Five Whys chain, a fishbone grouped into causes such as machine, method and material, or a fault tree with AND and OR gates.
Failures classified
A failure is recorded against its work order with its mode, cause, severity and how it was found, so the history uses one vocabulary.
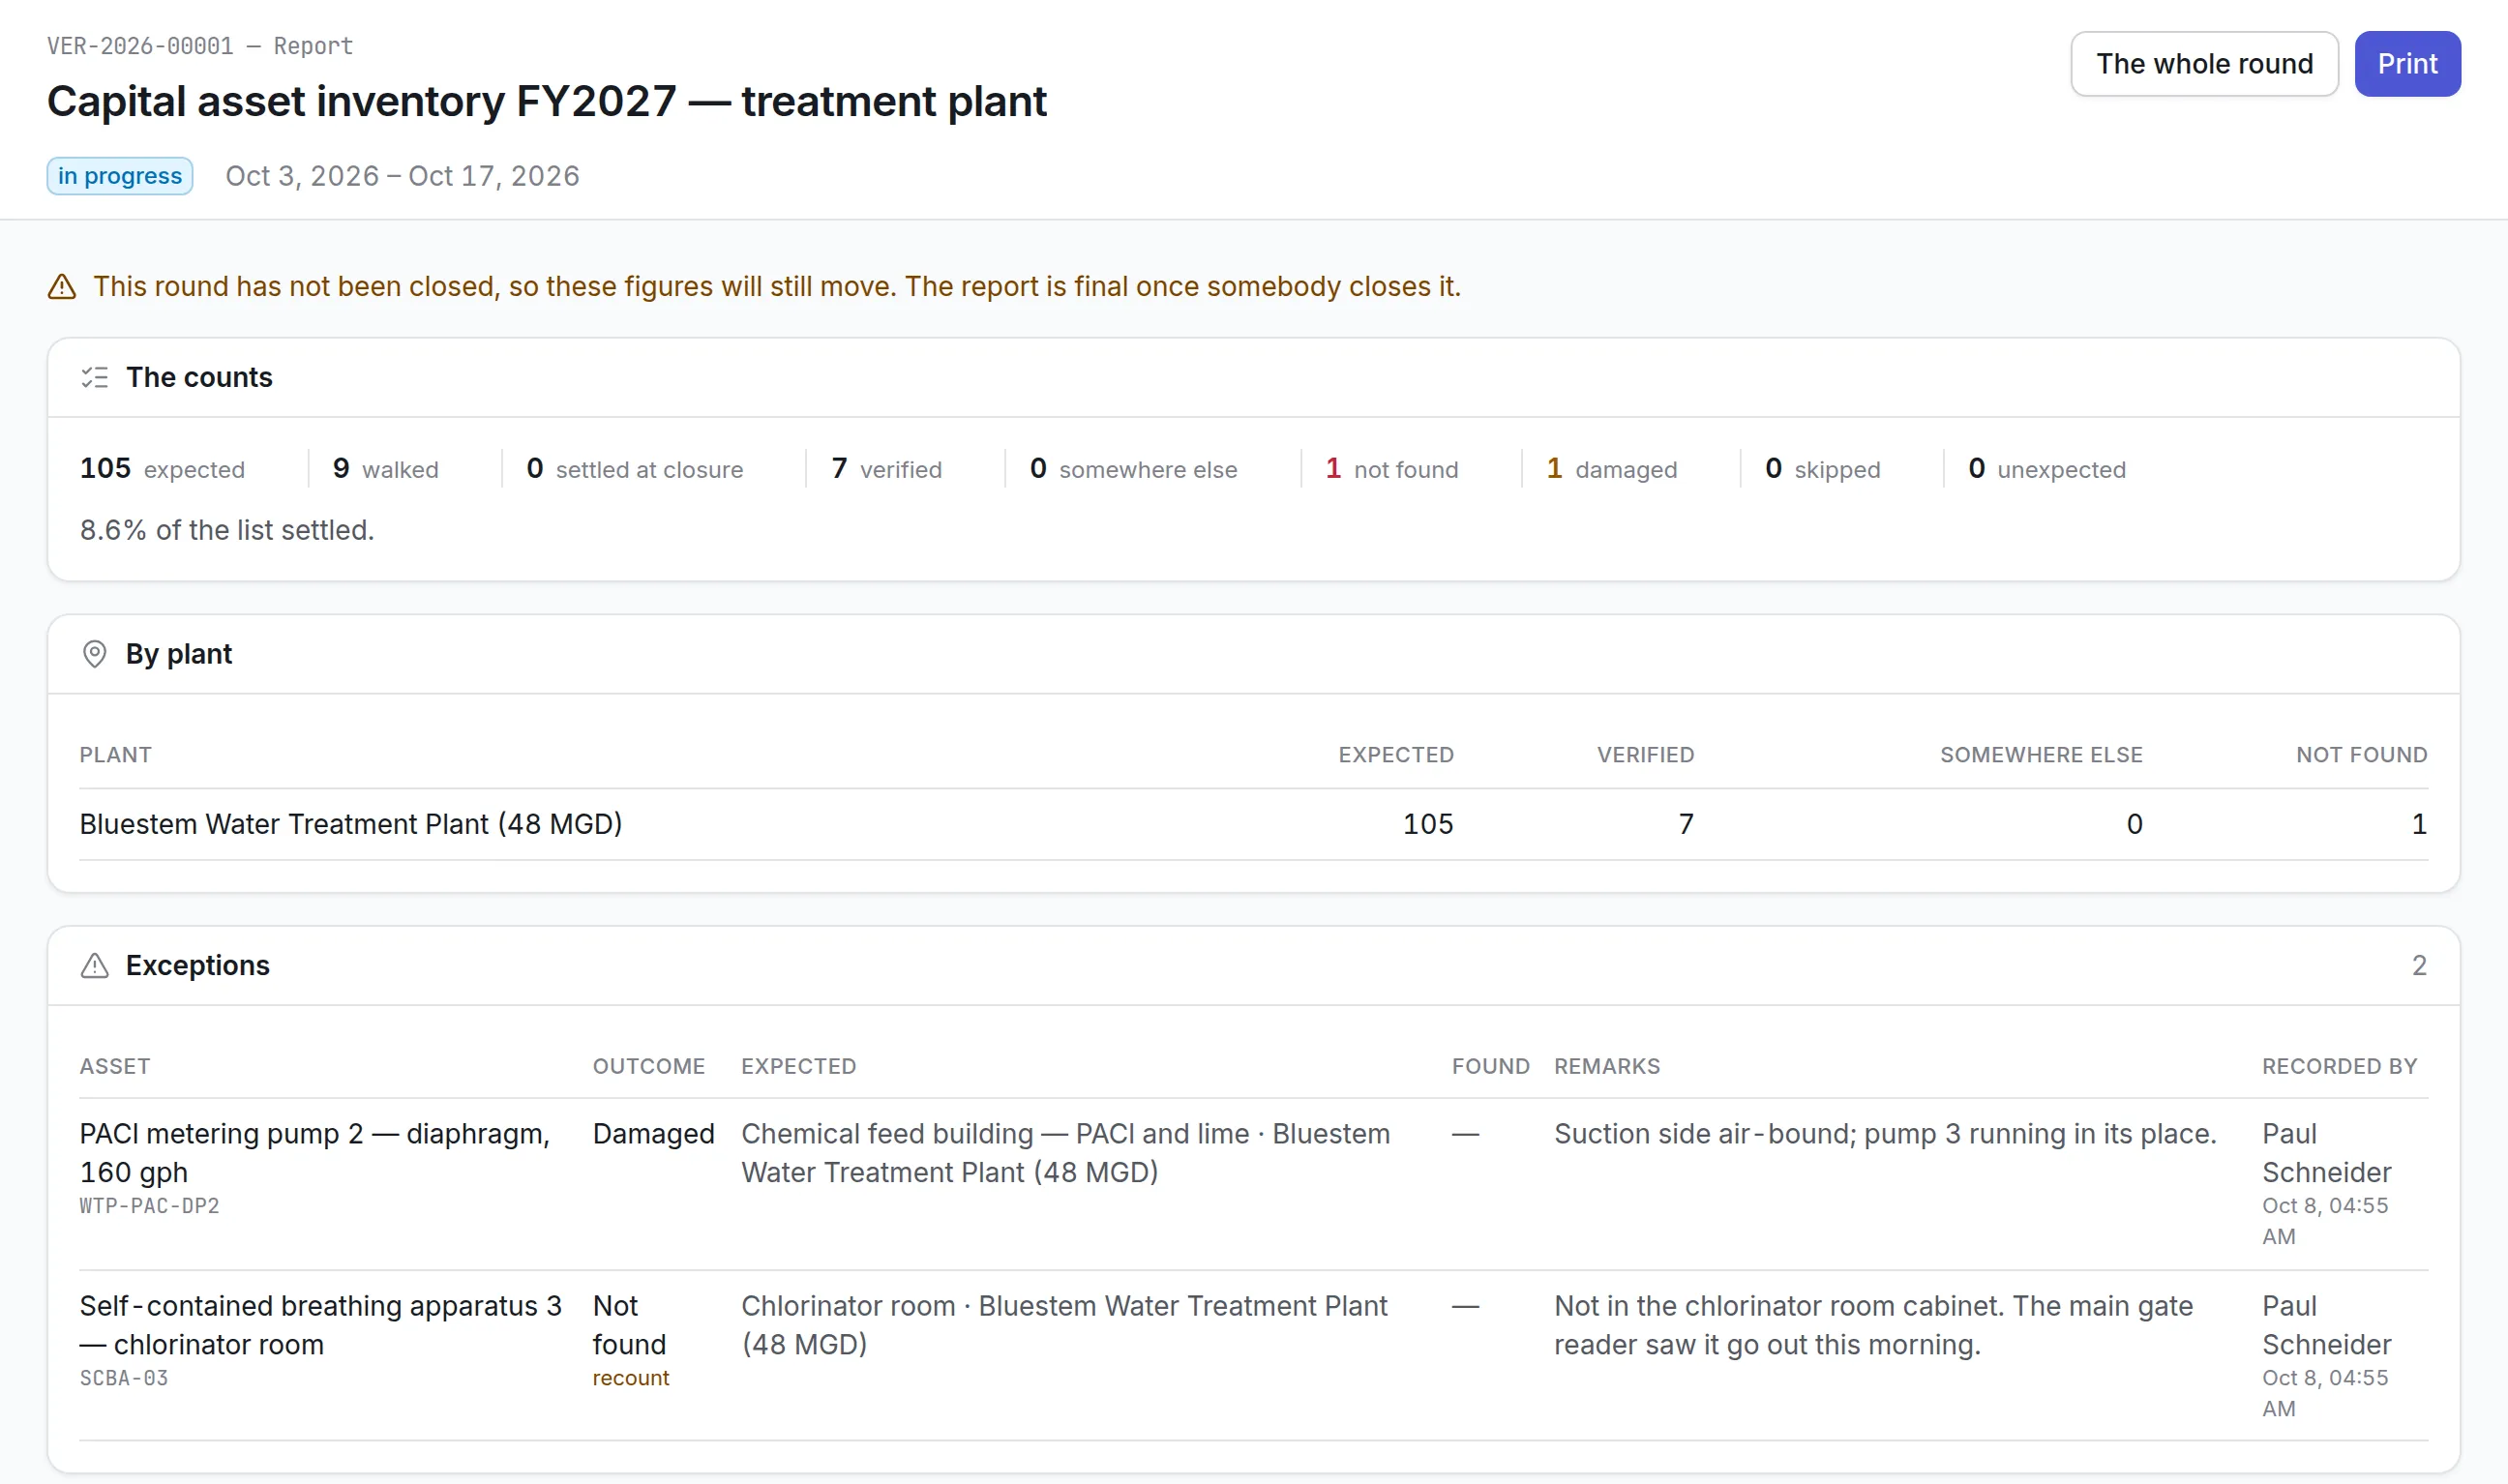
Actions that are verified
Corrective and preventive actions have owners and due dates. A closed action needs a verification, and its effectiveness is reviewed later.
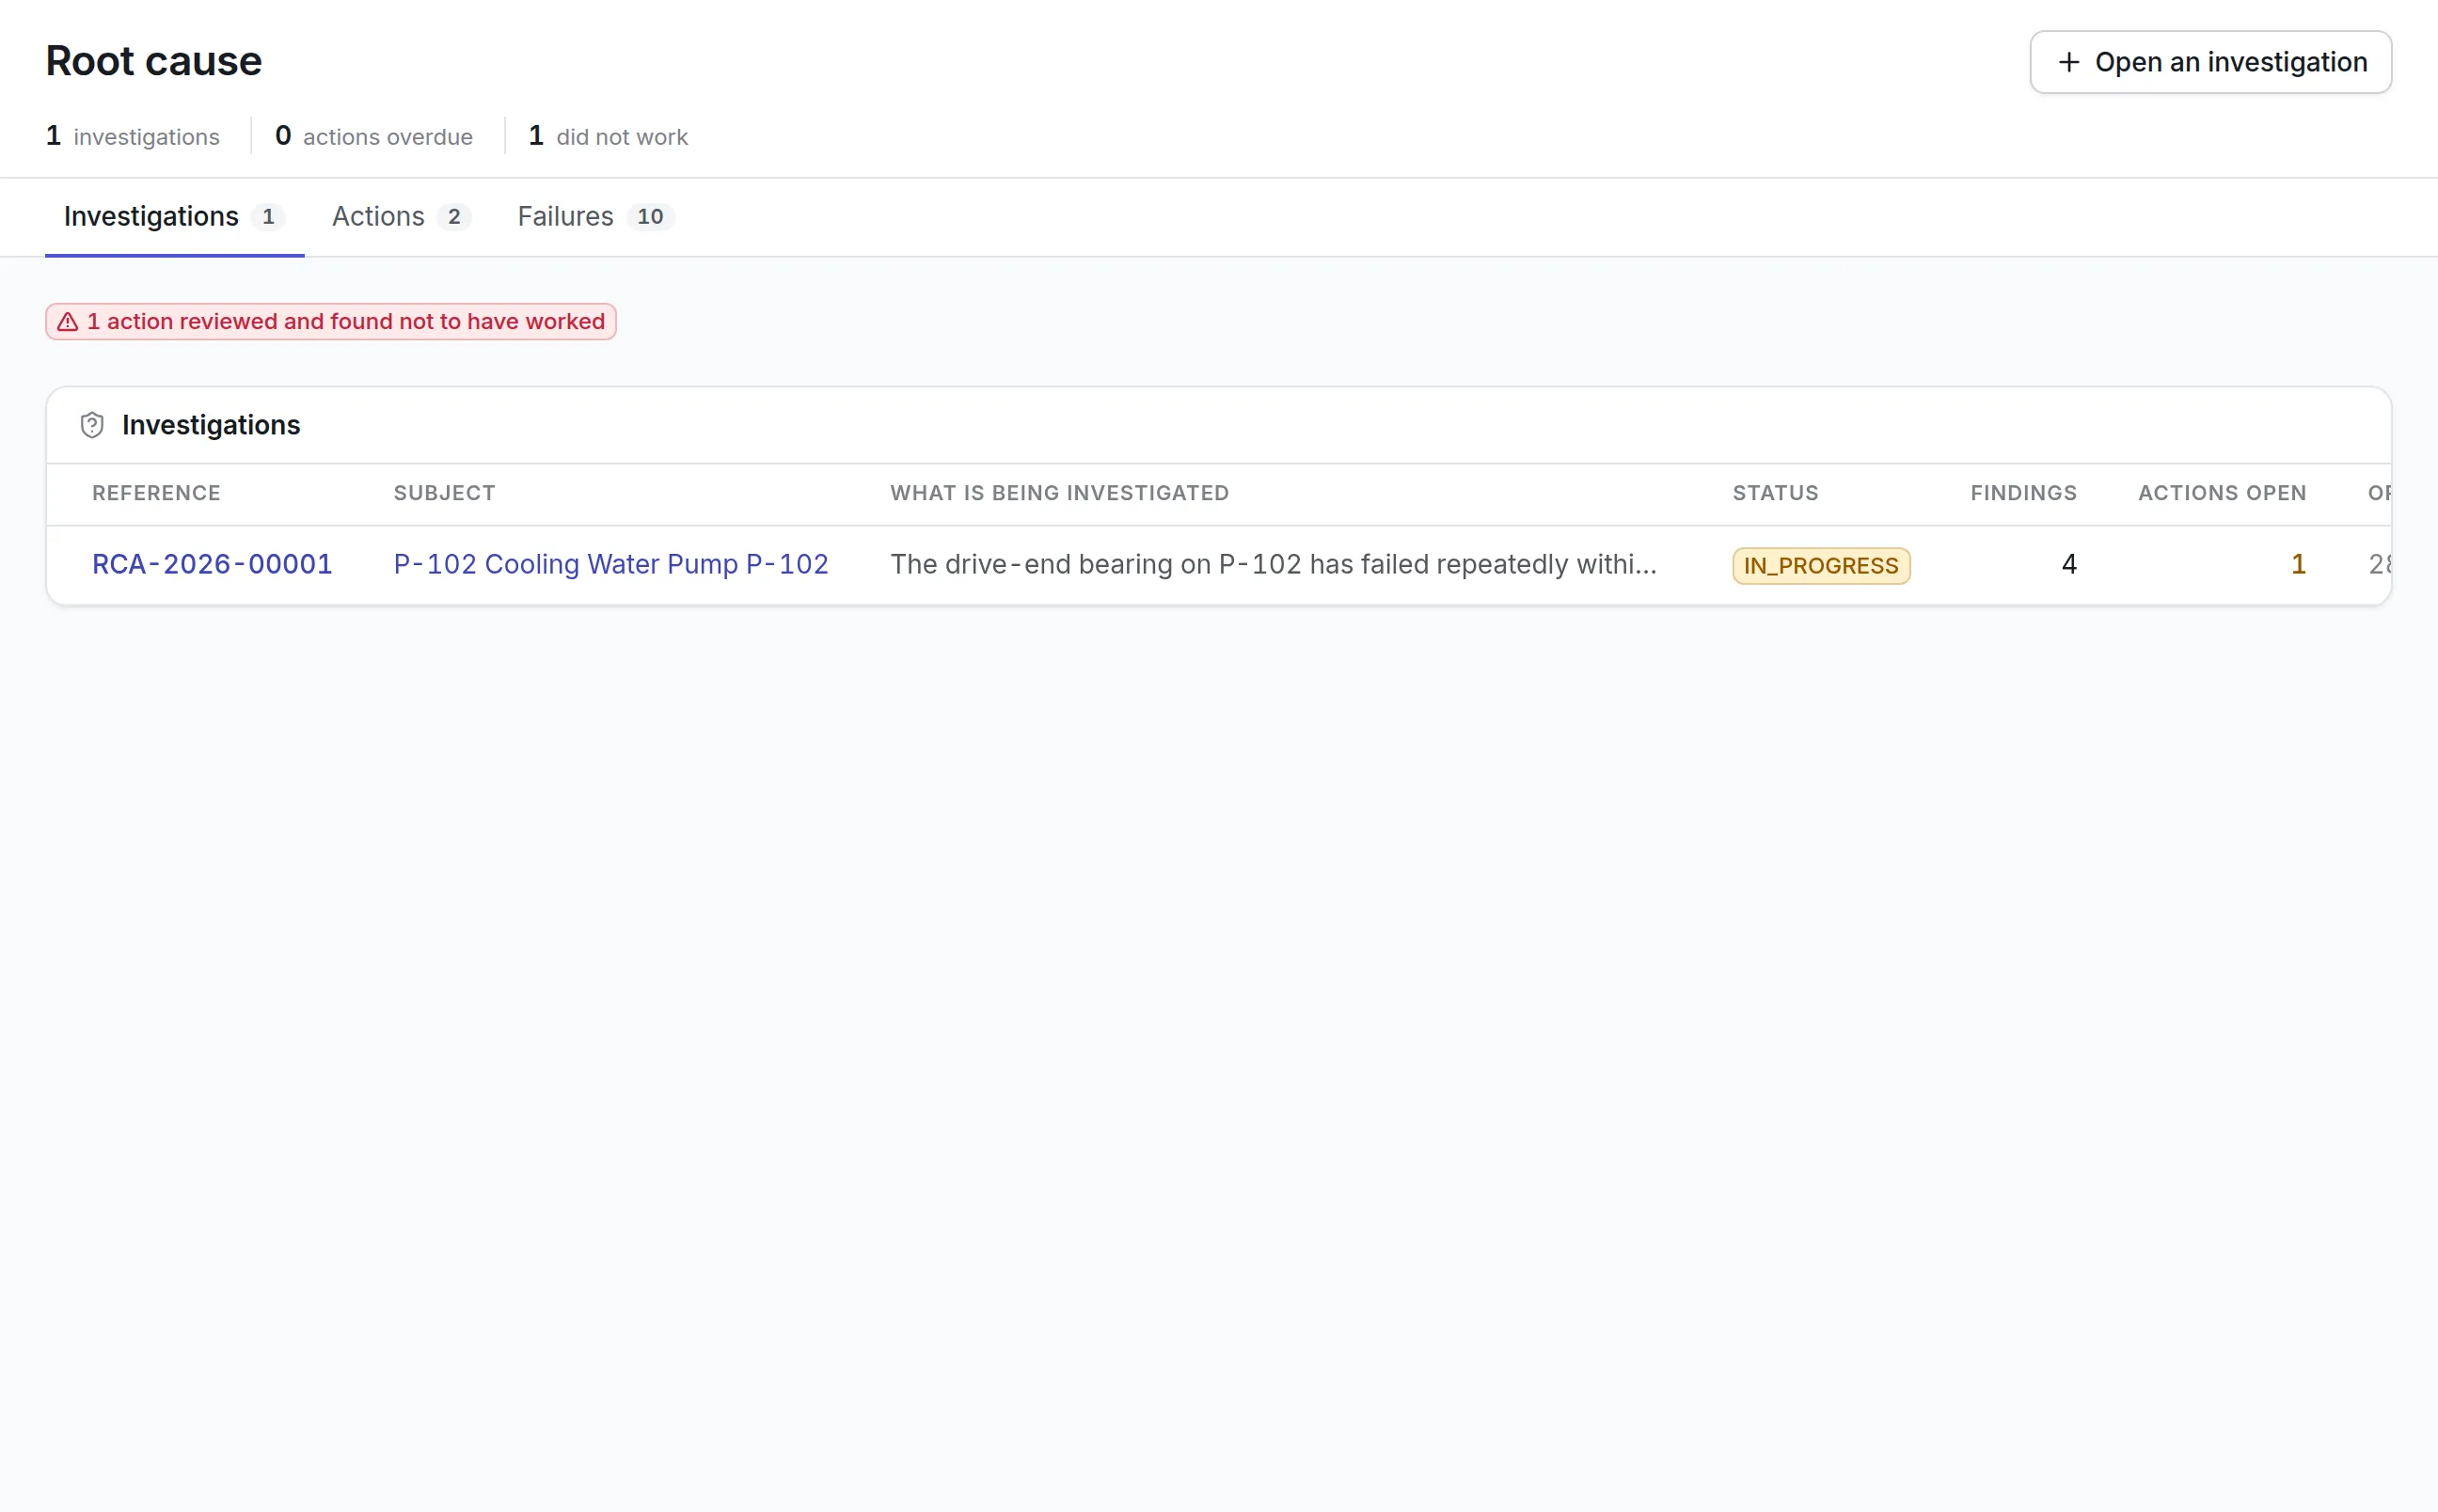
Fixes that did not work
When an effectiveness review finds an action did not stop the failure, the screen says so at the top until it is dealt with.
What is root cause analysis software?
Root cause analysis software helps a maintenance team find why a failure keeps happening, record the evidence for each cause, and track the corrective and preventive actions that follow until someone can say whether they worked. Good tools also point at which failures deserve an investigation in the first place.
Teams buy root cause analysis software when the same pump, conveyor or air handler keeps coming back on the work order list, and each repair is closed by a different technician who never sees the pattern.
How root cause analysis works in Asset Infinity
The drive-end bearing on a cooling water pump has failed ten times in a year, each time with excessive vibration or noise. Nobody connected the jobs, because each was raised by a different person and closed by a different technician. Here is how that pattern becomes a fix that holds.
- Failures are classified as jobs close.A work order type with failure capture asks what failed before the job can close. The technician picks the failure mode, and the cause and mechanism if known, with “Not sure” a valid answer.
- The reliability screen spots the pattern.Every night the figures are rolled up per asset from work orders and asset status history. The bearing is flagged as a Repeat fault, with the figures behind the flag.
- An investigation is opened.A reliability engineer opens one against the pump with a one-sentence problem statement, a method and a due date.
- Findings are drawn and evidenced.Using Five Whys, the team works back from the vibration to a coupling that was never realigned after seal replacements. Each finding records the evidence that makes it more than a guess.
- A root cause is marked and the investigation concluded.Concluding is blocked until at least one finding is marked as the root cause, because a conclusion with nothing behind it is an opinion.
- Actions are assigned.A corrective action fixes this pump; a preventive action adds a realignment step to the seal job’s checklist. Each has an owner and a due date.
- The fix is checked.Each action is marked done, then verified by someone else, then reviewed for effectiveness about ninety days after its due date: did the failures stop?
Reliability figures that pick what to investigate
Root cause analysis takes engineering time, so it should go where it pays. The reliability screen leads with recommendations, each written as an argument with numbers you can check.
| Recommendation | Raised when |
|---|---|
| Replace | An asset’s maintenance cost is approaching or passing what it cost to buy |
| Review the plan | An asset keeps failing despite a maintenance plan running against it |
| Repeat fault | An asset has failed the same way several times |
| Bad actor | An asset is in the worst fifth of the fleet on failures, downtime and cost |
Each one can be dismissed with Disagree, which asks why and records the reason. Below the recommendations, Worst first ranks assets with a percentile beside each figure, so “seven failures” reads as worse than most of the fleet or not. The header carries availability, MTBF, MTTR, preventive rounds on time, hours down and assets at risk, over 3, 6 or 12 months.
See it on your own assets, or price it in two minutes.
Five Whys, fishbone and fault tree investigations
Each investigation draws its findings the way its method reads, and all of them lead to the same tracked actions.
More detail
A finding with confirmed evidence shows as evidenced. Change the evidence afterwards and it stops being evidenced, because whoever confirmed it confirmed something else.
Actions followed until they work
An investigation that reaches a root cause changes nothing on its own. The Actions tab is the register of every corrective and preventive action, sorted by what each is waiting for.
More detail
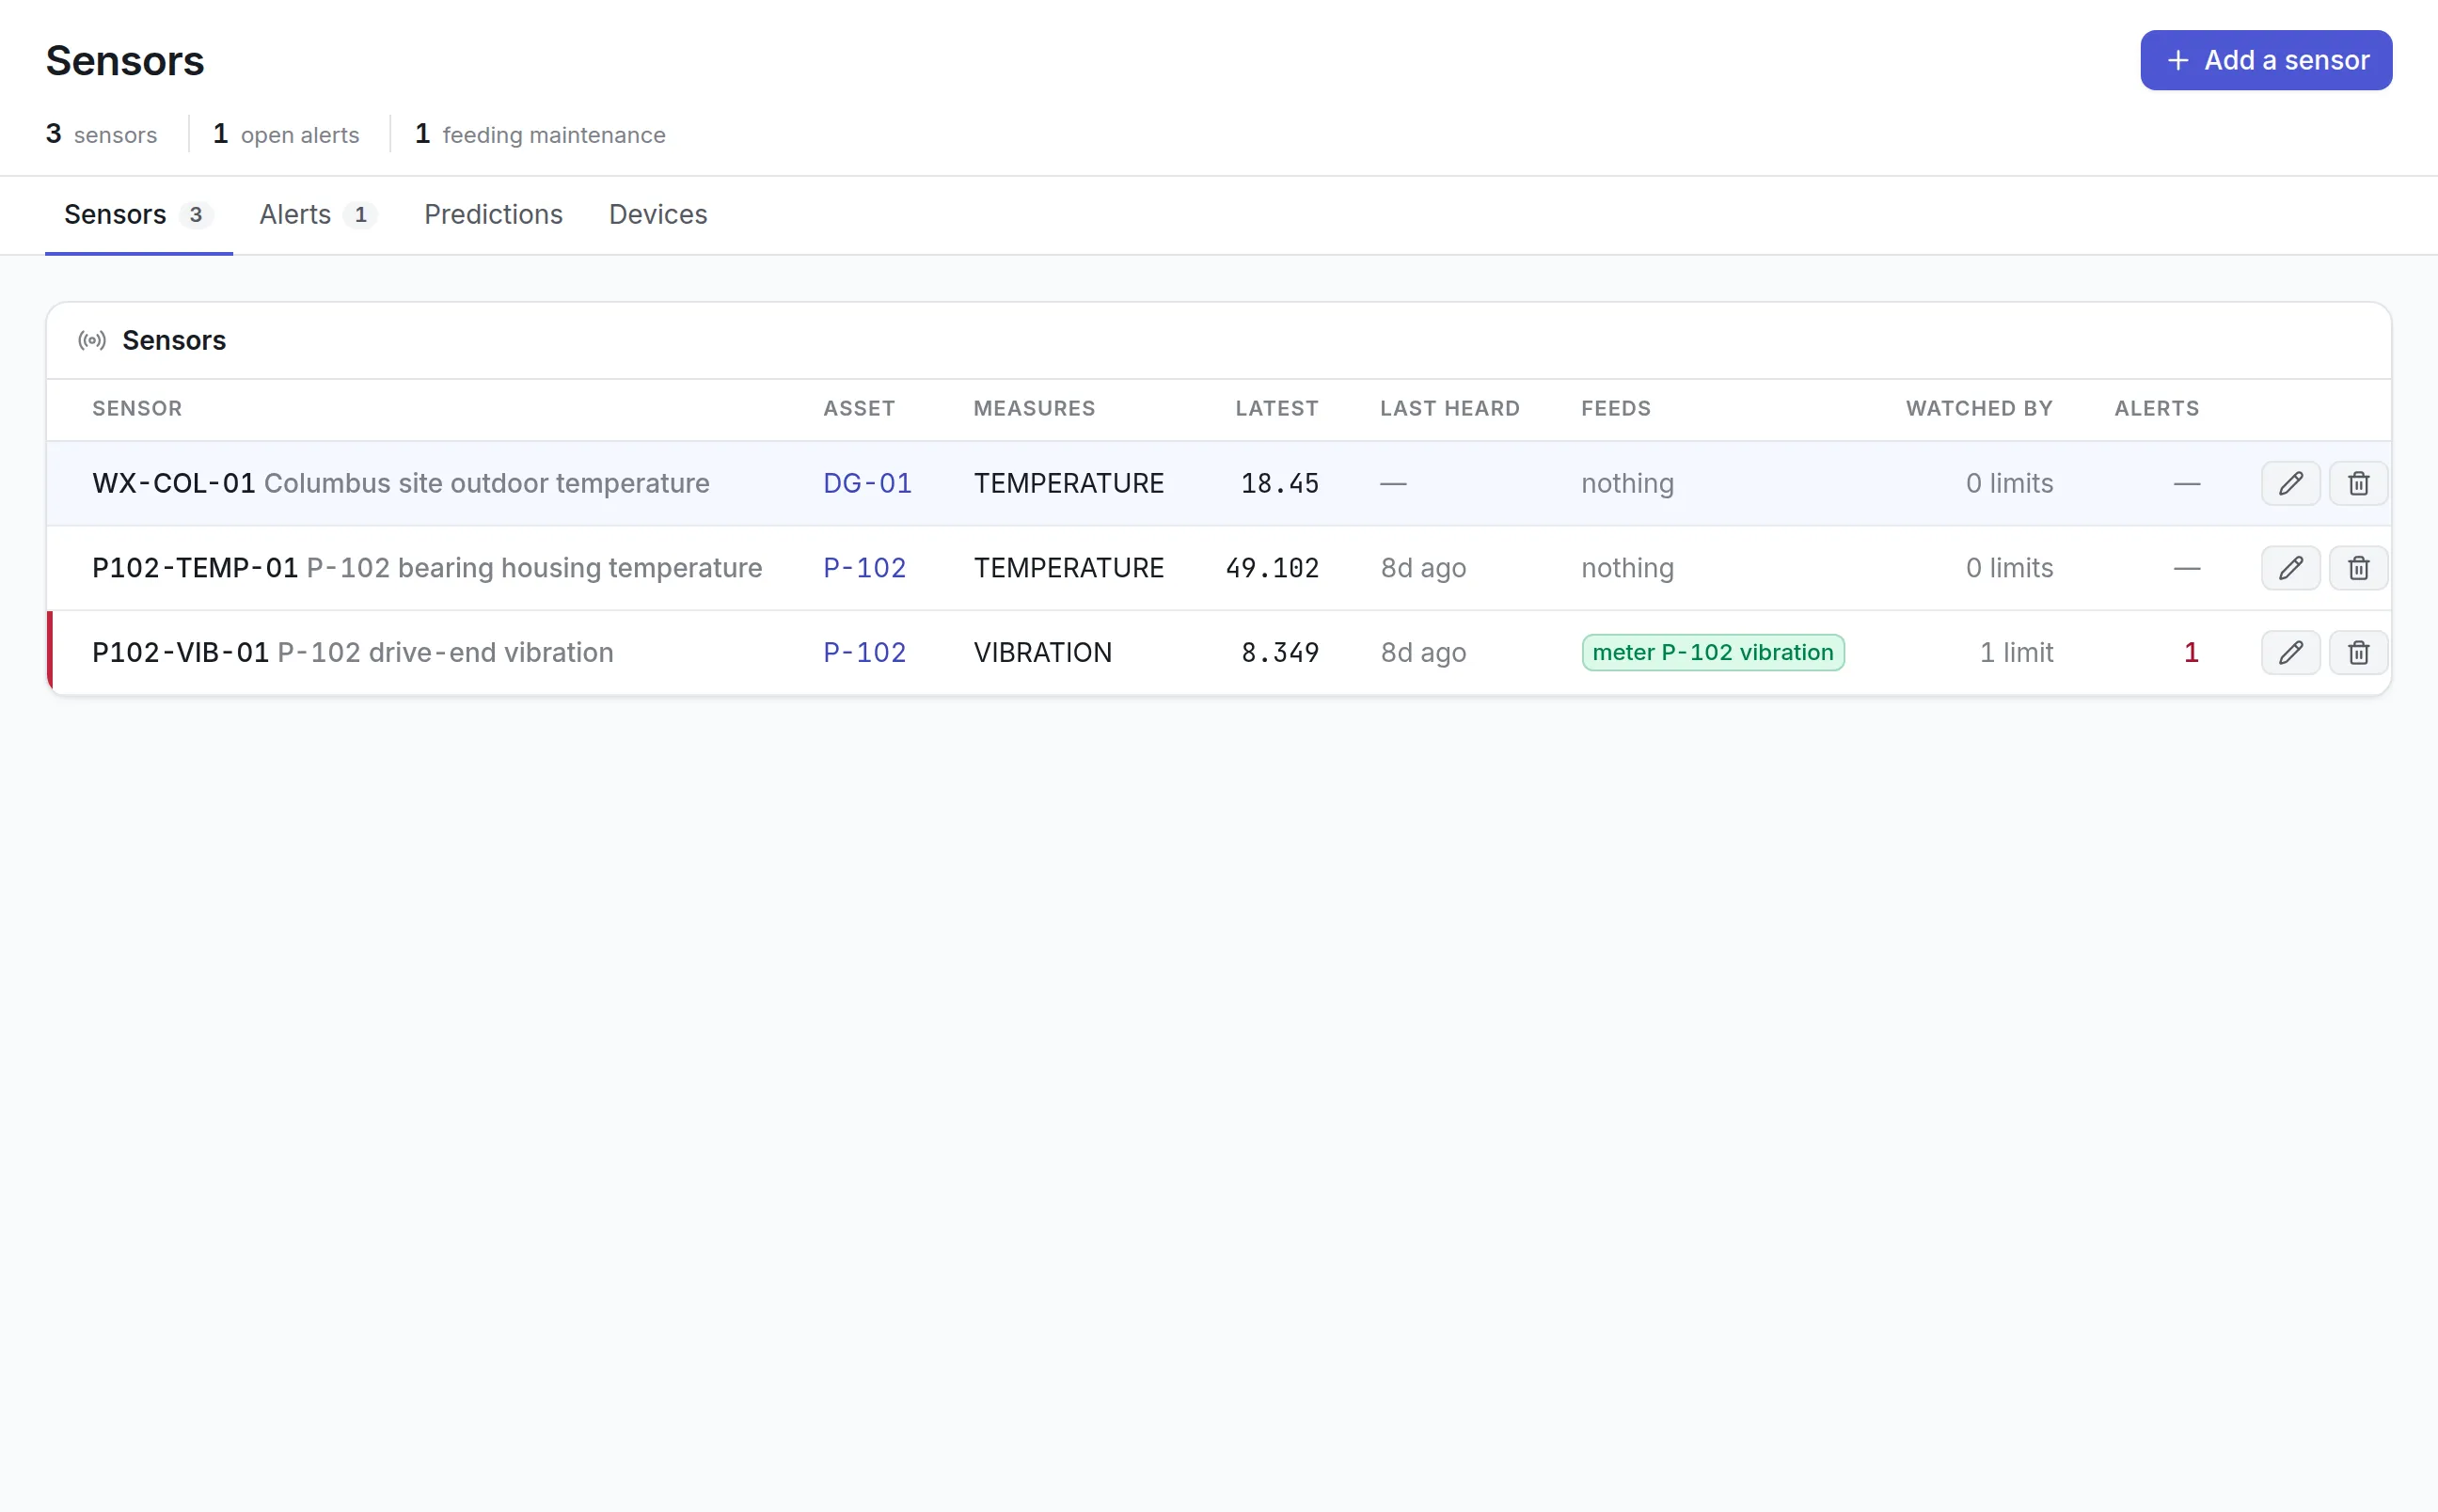
An action that did not work stays at the top of the screen until someone deals with it, because it means the diagnosis was wrong. Sensor limits added as actions feed predictive maintenance software, and changed checklists flow into preventive maintenance software.
A failure vocabulary everyone shares
Free-text failure notes are a paragraph, not a pattern. Asset Infinity keeps three lists apart, and a new organization starts with a working set of each:
More detail
Keeping them apart is the point. “Bearing seized” is a mode, misalignment is a cause and fatigue is a mechanism, and a chart of “bearing failure” alone tells nobody whether to buy a better coupling or train a fitter.
What to look for in root cause analysis software
| Capability | Why it matters | In Asset Infinity |
|---|---|---|
| Failure data from work orders | A second failure log is never kept up to date | Failures classified when jobs close |
| Structured taxonomy | Free text cannot be counted | Separate modes, mechanisms and causes |
| Recommendations with evidence | Engineers should investigate what pays | Repeat fault, bad actor, replace and review the plan |
| Several methods | Different problems suit different tools | Five Whys, fishbone and fault tree |
| Evidence on findings | Guesses should look like guesses | Findings marked evidenced only with confirmed evidence |
| Conclusion needs a root cause | Investigations should end in a decision | Conclude is blocked until a root cause is marked |
| Verified actions | Done is not the same as checked | Separate mark done and verify steps |
| Effectiveness review | A fix that did not work is a wrong diagnosis | Review set about 90 days after the due date |
Root cause analysis by industry
A manufacturing plant
Rotating equipment produces most repeat faults. Turn on failure capture for breakdown work, and let the Repeat fault flag decide which bearings and seals get a Five Whys. Fixes often land as a changed PM checklist, so the next round carries the lesson. More on maintenance in manufacturing.
A water or wastewater utility
Pumps, valves and blowers fail in patterns across many sites. Worst first ranks them across the whole fleet with percentiles, and a fault tree suits failures with more than one way in, such as a pump trip that needs both a blocked intake and a failed level switch.
A hospital or large facility
Air handlers, chillers and elevators fail in ways patients and tenants notice. A fishbone grouped into machine, method and material helps separate an equipment fault from a procedure gap, and the Replace recommendation flags units costing more to keep than to renew.
A fleet
Vehicles that keep returning to the shop show as bad actors on failures, downtime and cost, ranked against the rest of the fleet. Failure modes recorded by mechanics show whether the trouble is one component or many, and replacement recommendations compare a year’s maintenance spend with the purchase price, which feeds capital planning software.
What root cause analysis software costs in Asset Infinity
The asset register starts at $130 a month for up to 500 assets, with unlimited users. Work orders, which supply the failure history, come with the Maintenance module at $25 per user per month. Reliability and root cause is an add-on at $150 a month for the whole organization. Build a quote for your sites, and see maintenance reporting for the dashboards that carry the same figures.
Getting started with root cause analysis software
Root cause analysis software needs failure history before it can point anywhere useful, so the first weeks are about recording:
Every figure comes from closed jobs in work order software, so the habit that matters most is closing work with an honest failure code.
More in Maintain
Common questions
What is root cause analysis software?
Root cause analysis software helps a team investigate why a failure happened, record the causes they find and track the actions taken to stop it happening again.
How does Asset Infinity decide which assets to investigate?
It reads failure history from work orders. An asset that fails the same way repeatedly, costs more than it is worth to maintain, or ranks in the worst fifth on failures, downtime and cost is flagged with the numbers behind the flag.
Which RCA methods are supported?
Five Whys, fishbone (Ishikawa) and fault tree analysis. All three record findings against the same investigation and lead to the same tracked actions.
Where do MTBF and MTTR come from?
From your work orders. They are calculated from corrective work orders and their status history, so there is no second failure log to keep.
How is MTBF calculated?
Mean time between failures is the operating time in a period divided by the number of failures in it, and mean time to repair is total repair time divided by the number of repairs. Asset Infinity works both out per asset every night and needs at least two failures before it shows an MTBF.
What is the difference between a corrective and a preventive action?
A corrective action fixes the problem that happened on this asset. A preventive action changes something, such as a procedure or a maintenance plan, so the failure does not happen again here or elsewhere.
See it with your own assets
A demo run on an example from your industry. Or start the trial and look around on your own.