

An asset management dashboard is the screen that tells you, at a glance, how your assets are doing: how many you have and where, which are down, what maintenance is overdue, what they cost to run and what they are worth. It turns the records your team already keeps into a few numbers and charts that someone can act on before the problem grows.
Most organizations already have the data. It sits in the asset register, in work orders and in purchase records, and someone rebuilds a spreadsheet from it every Monday. This guide covers what an asset management dashboard should show, the KPIs worth tracking, how reports and dashboards work together, examples by team, and what to look for in customizable dashboards.
What is an asset management dashboard?
An asset management dashboard is a visual summary of an organization’s assets and their upkeep, built from live records in an asset or maintenance system. It shows counts, statuses, costs, maintenance backlog, depreciation and reliability figures as tiles, charts and tables, so managers can spot trends and exceptions without running a report.
A dashboard answers the question “what needs my attention?” A report answers “show me all of it.” Good asset management reporting uses both: the dashboard to see that something is wrong, and the report behind it to find out exactly what.
Why asset management reporting matters
Reporting on assets pays off in five practical ways.
- Accountability. Reports show who has each asset, how long they have had it and what happened to it, which discourages misuse and settles disputes.
- Maintenance before failure. Overdue preventive work and repeat faults show up on the dashboard before a machine stops a line.
- Better decisions. Repair, replace or redeploy decisions rest on maintenance cost, age and utilization, not on whoever argues loudest.
- Compliance. Inspection records, verification results and disposal history are ready for an auditor or regulator.
- Lower costs. Idle assets, duplicate purchases and assets that cost more to keep than to replace become visible.
Asset management KPIs to put on the dashboard
Pick the measures your team is actually judged on. These are the ones most asset and maintenance teams start with.
| KPI | What it tells you | Who watches it |
|---|---|---|
| Assets by status | How many are operational, under maintenance, in breakdown or retired | Operations, maintenance |
| Utilization | How much each asset or asset class is used, and what sits idle | Operations, finance |
| Maintenance backlog | Open work orders waiting to be done | Maintenance managers |
| Overdue preventive maintenance | Planned work past its due date | Maintenance managers |
| PM compliance | Share of planned work done on time | Maintenance, quality |
| Downtime and availability | How long assets were out of service | Plant and reliability engineers |
| MTBF and MTTR | Average time between failures, and average time to repair | Reliability engineers |
| Maintenance cost | Labor, parts and vendor cost by asset, site or month | Maintenance, finance |
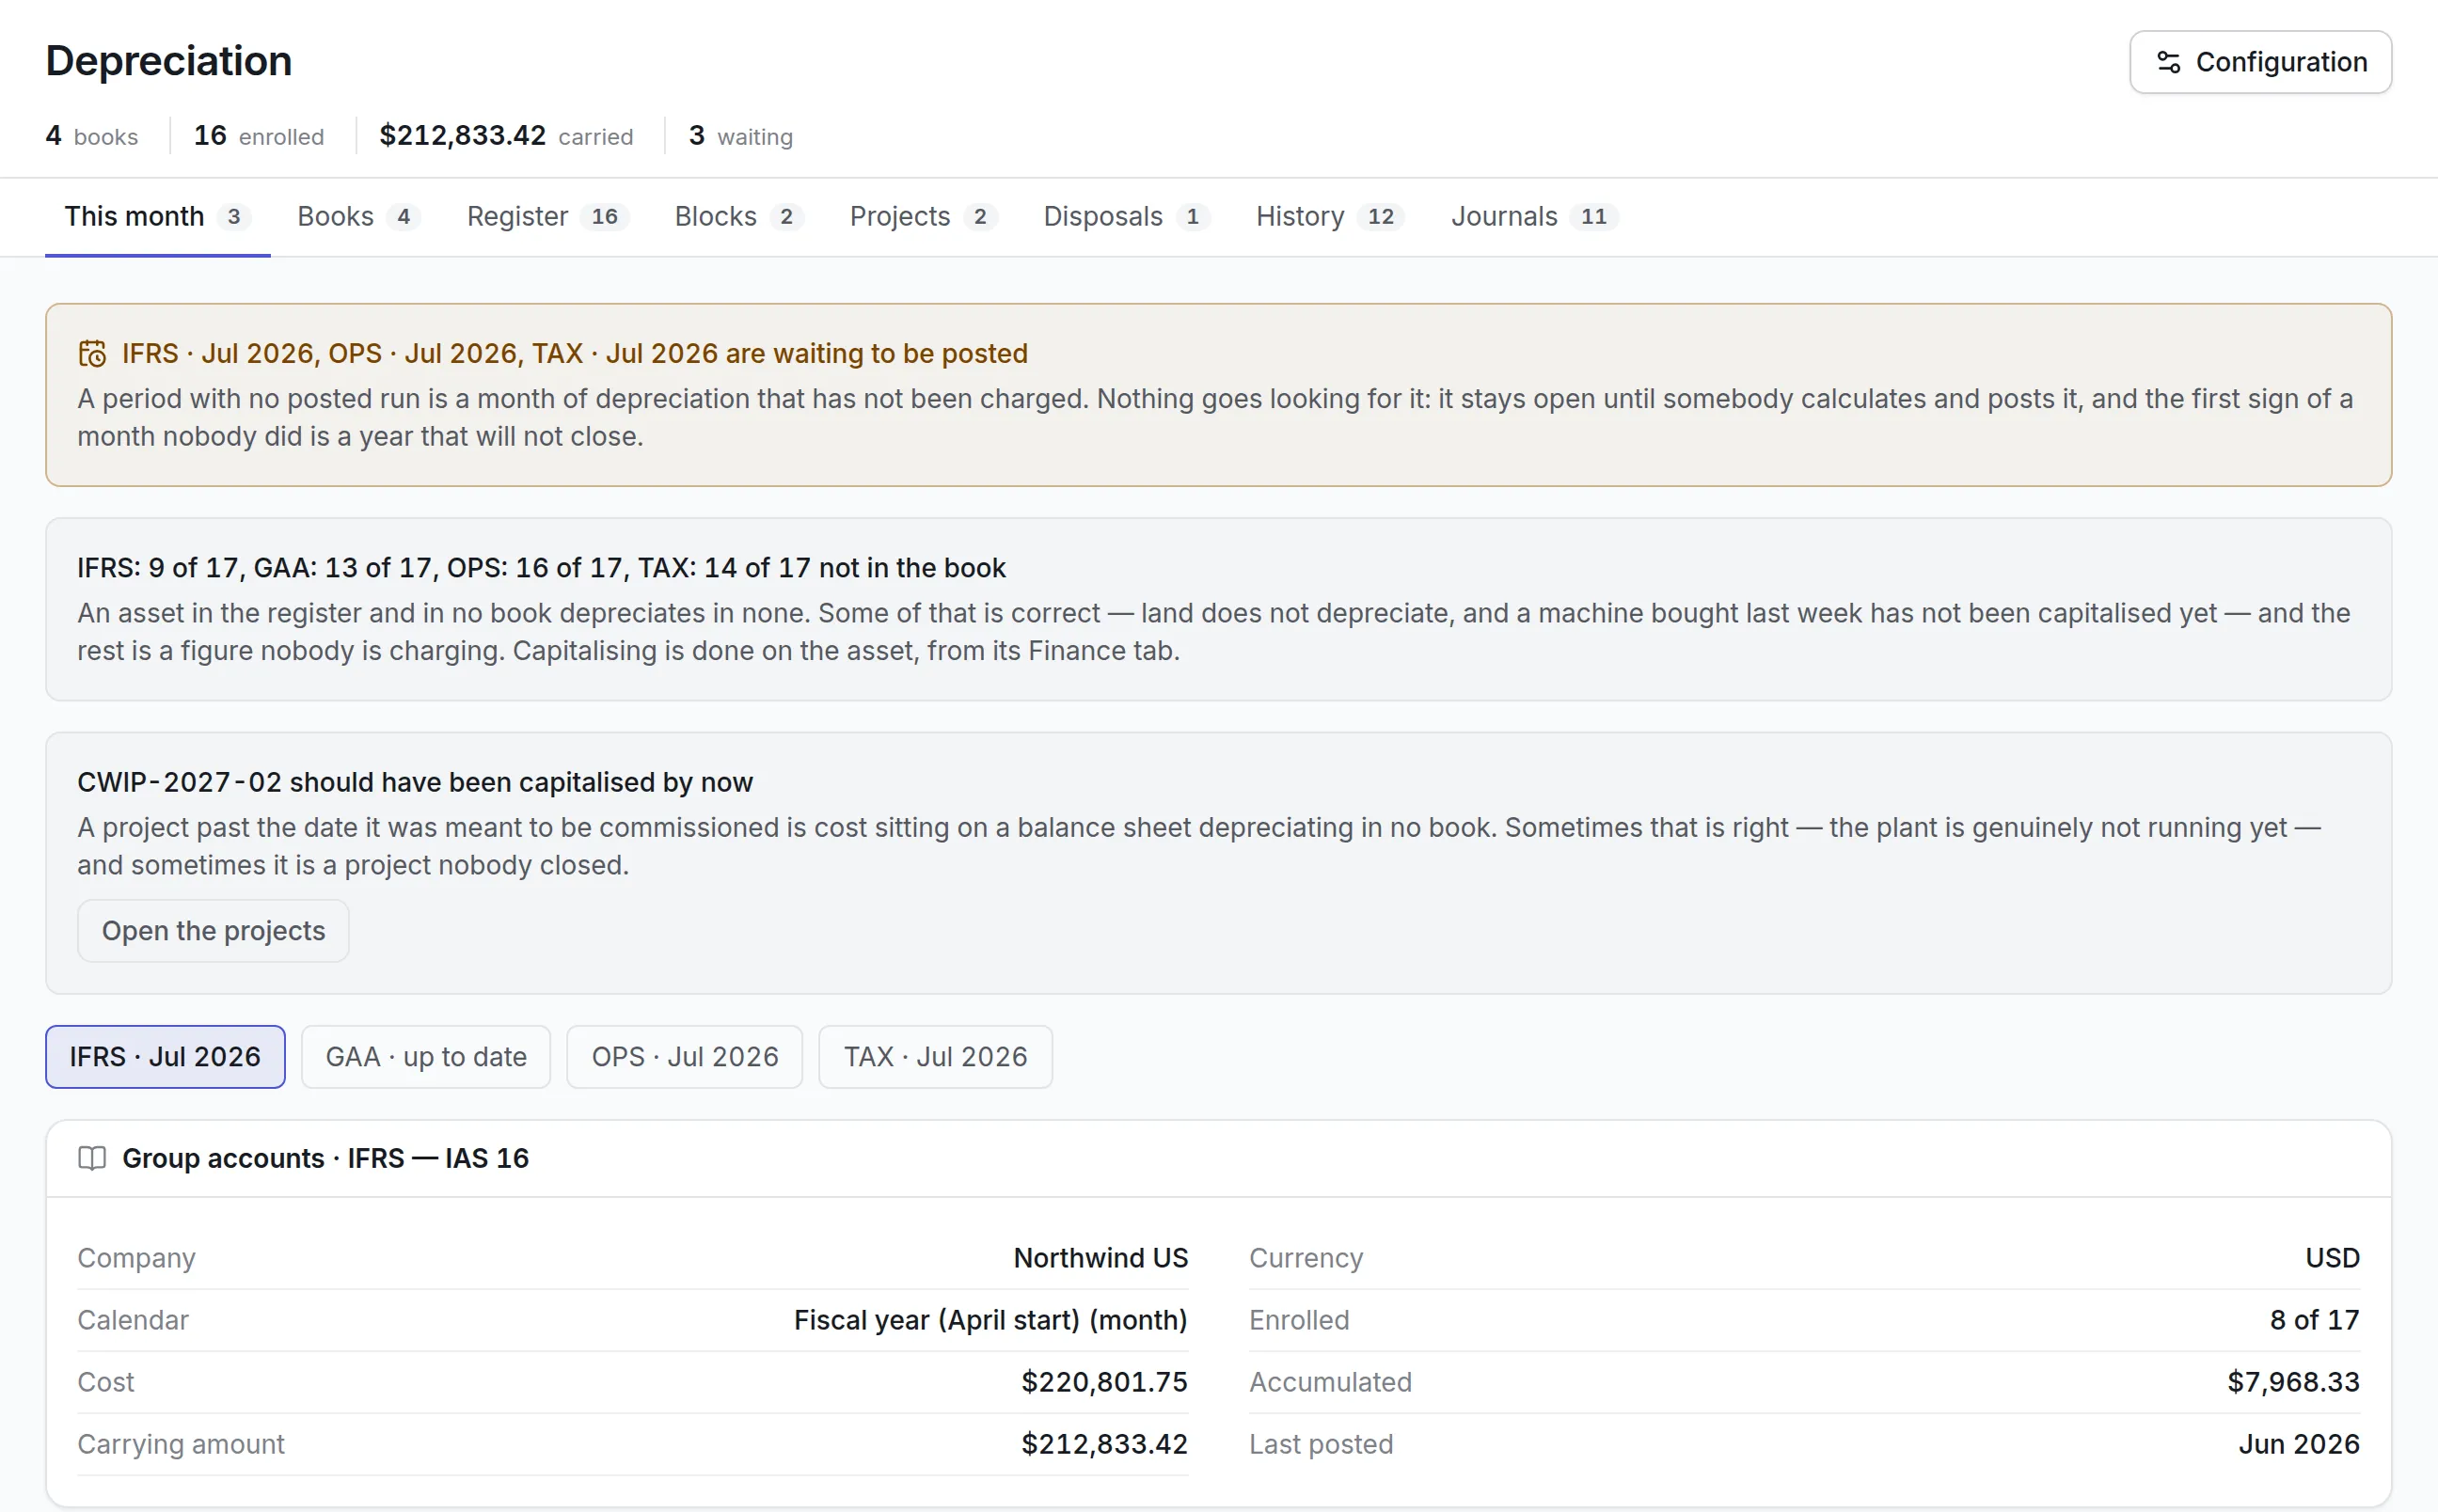
| Depreciation and book value | What the asset base is worth now, by class | Finance |
| Warranty and contract expiry | What runs out in the next 30, 60 or 90 days | Procurement, IT |
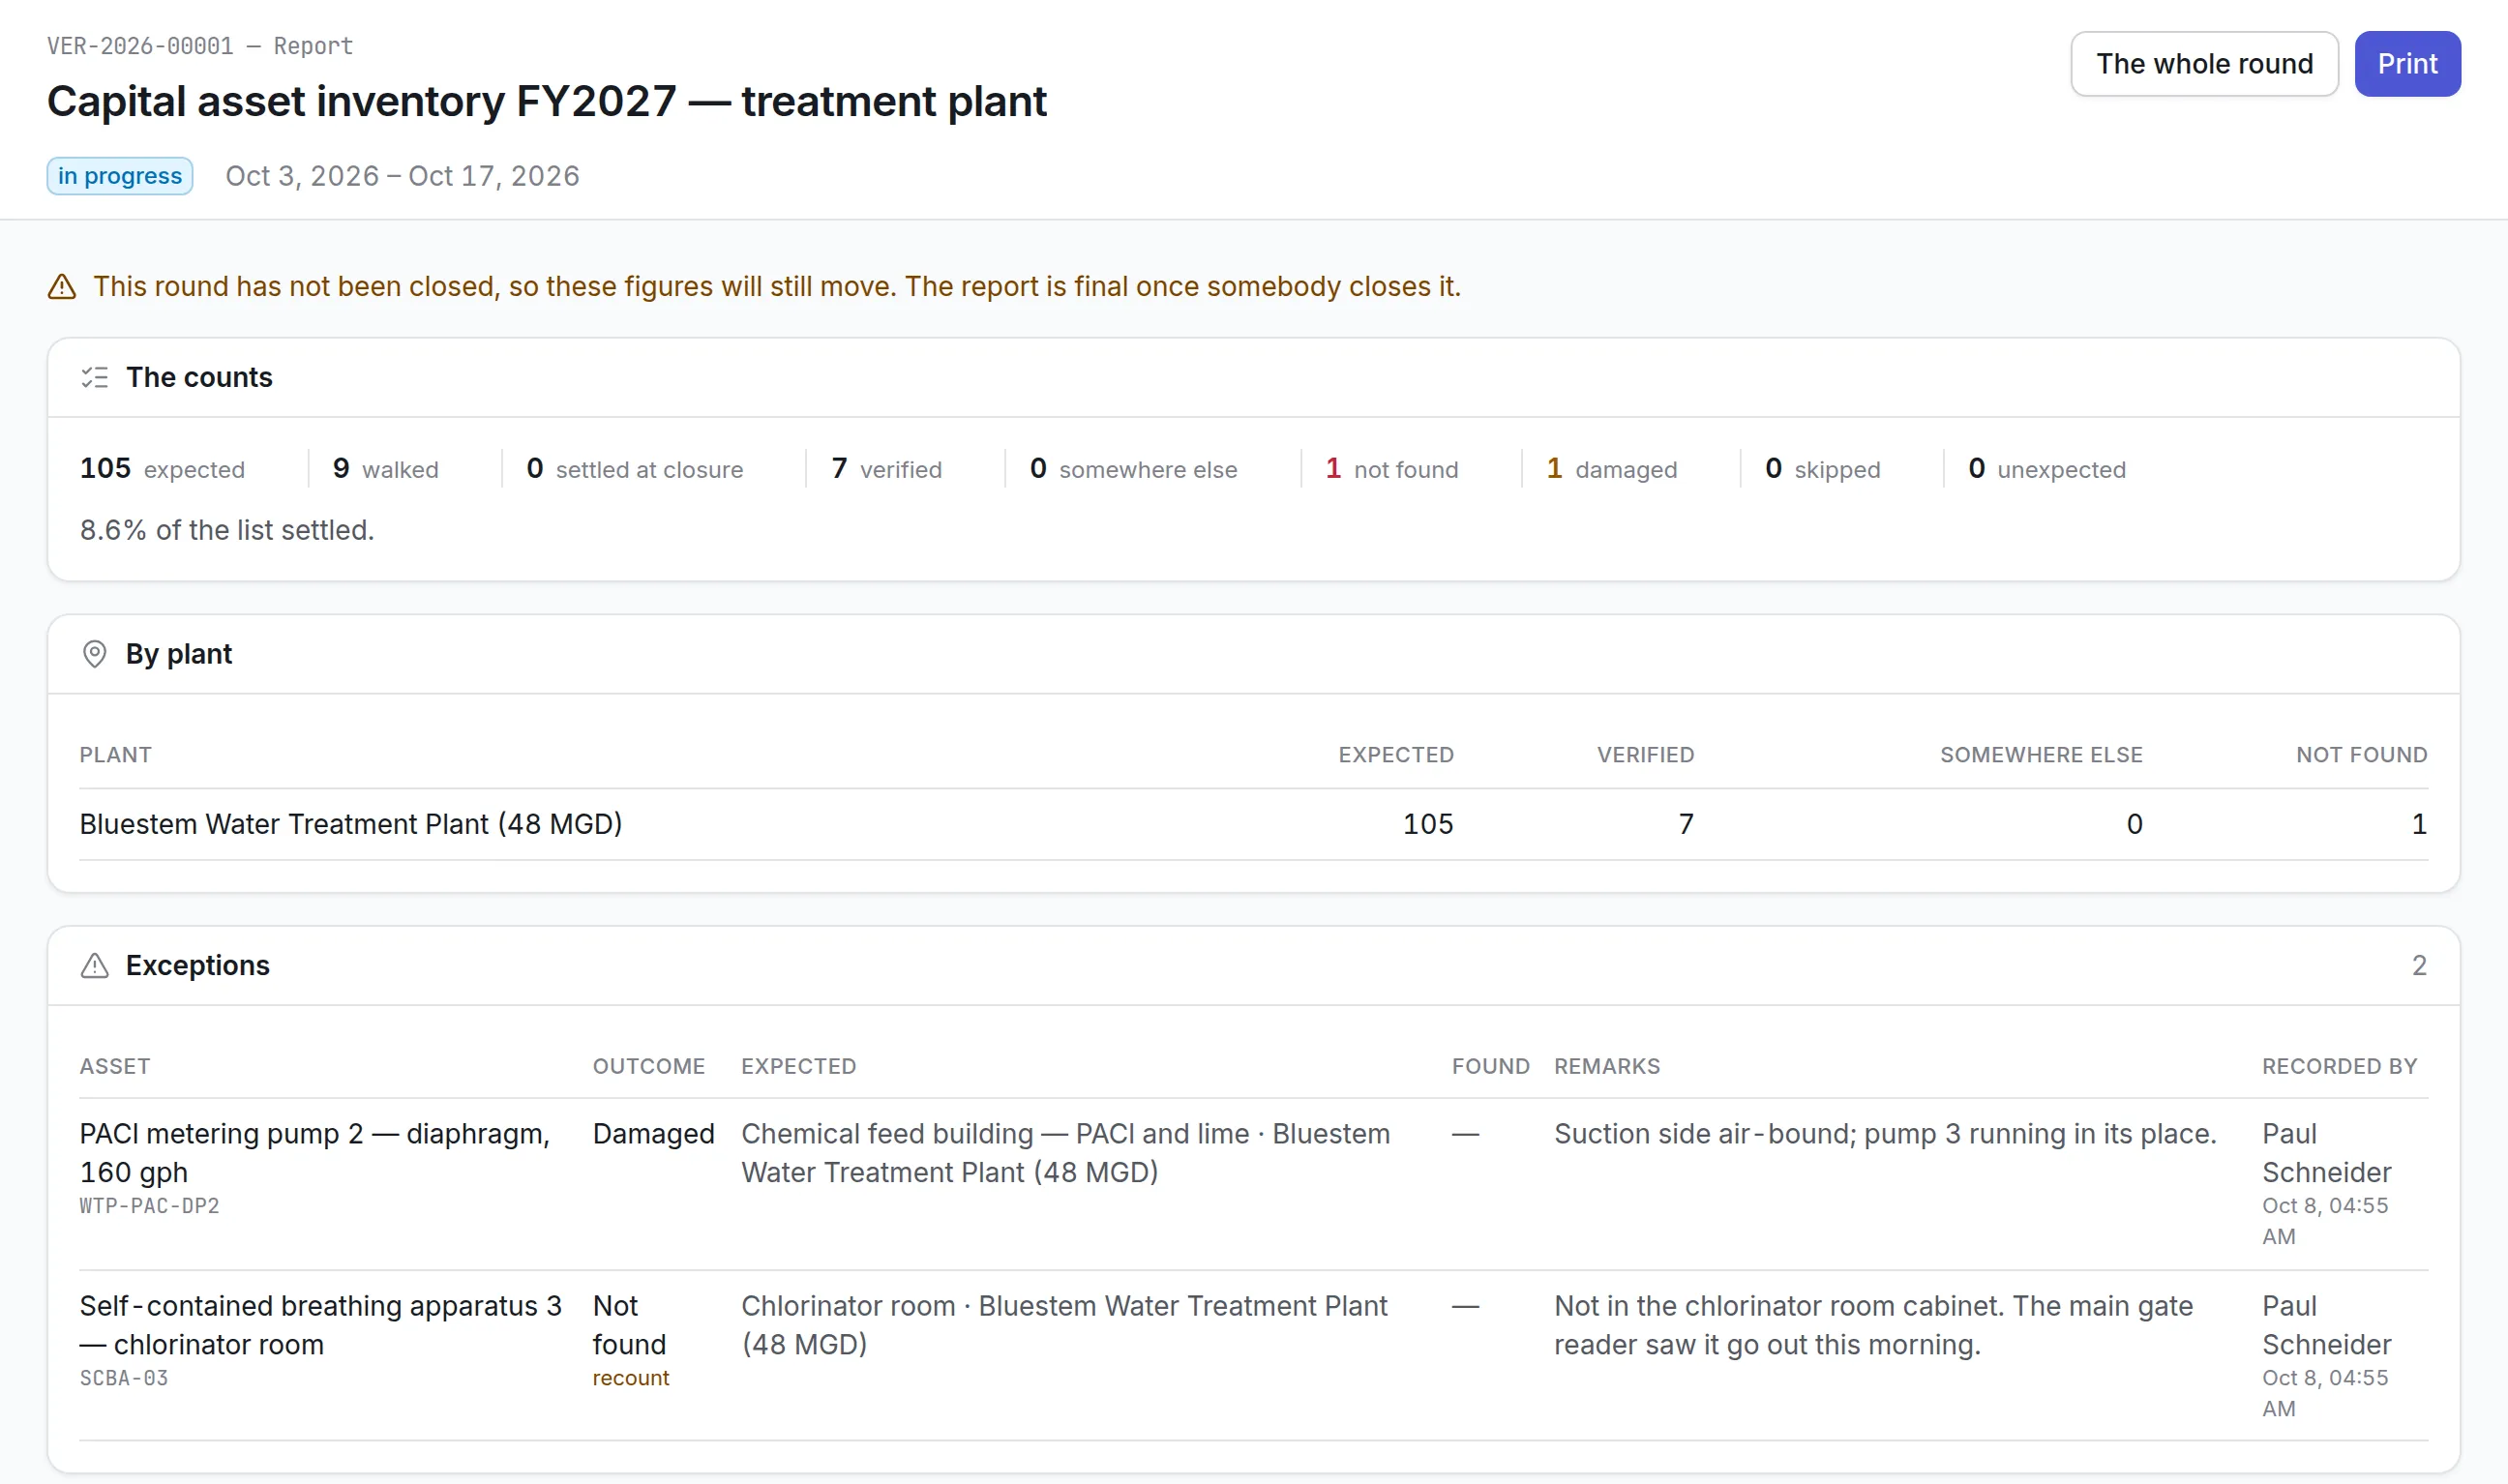
| Verification results | Assets found, moved, damaged or not found in the last count | Finance, audit |
| Return on assets | Profit generated relative to the asset base | Leadership, finance |
Twelve tiles is already a lot. A dashboard that tries to show everything gets ignored, so start with five or six and add more when someone asks.
How dashboards support each stage of the asset life cycle
The same data serves different decisions as an asset moves through its life.
- Acquire. Reports on past performance, maintenance cost and utilization by asset type show which models to buy again and where an existing idle asset could fill the need.
- Operate and maintain. Backlog, overdue work, downtime and repeat faults show where maintenance is falling behind and which assets fail most.
- Plan replacement. Age, condition, book value and cost to keep show which assets are near the point where replacing them is cheaper than repairing them.
- Dispose. Disposal reports record why each asset left (sold, scrapped, lost, donated, transferred) and the gain or loss, which keeps the books and the register in step.
Asset management dashboard examples by team
Each team needs a different view of the same records.
Maintenance managers
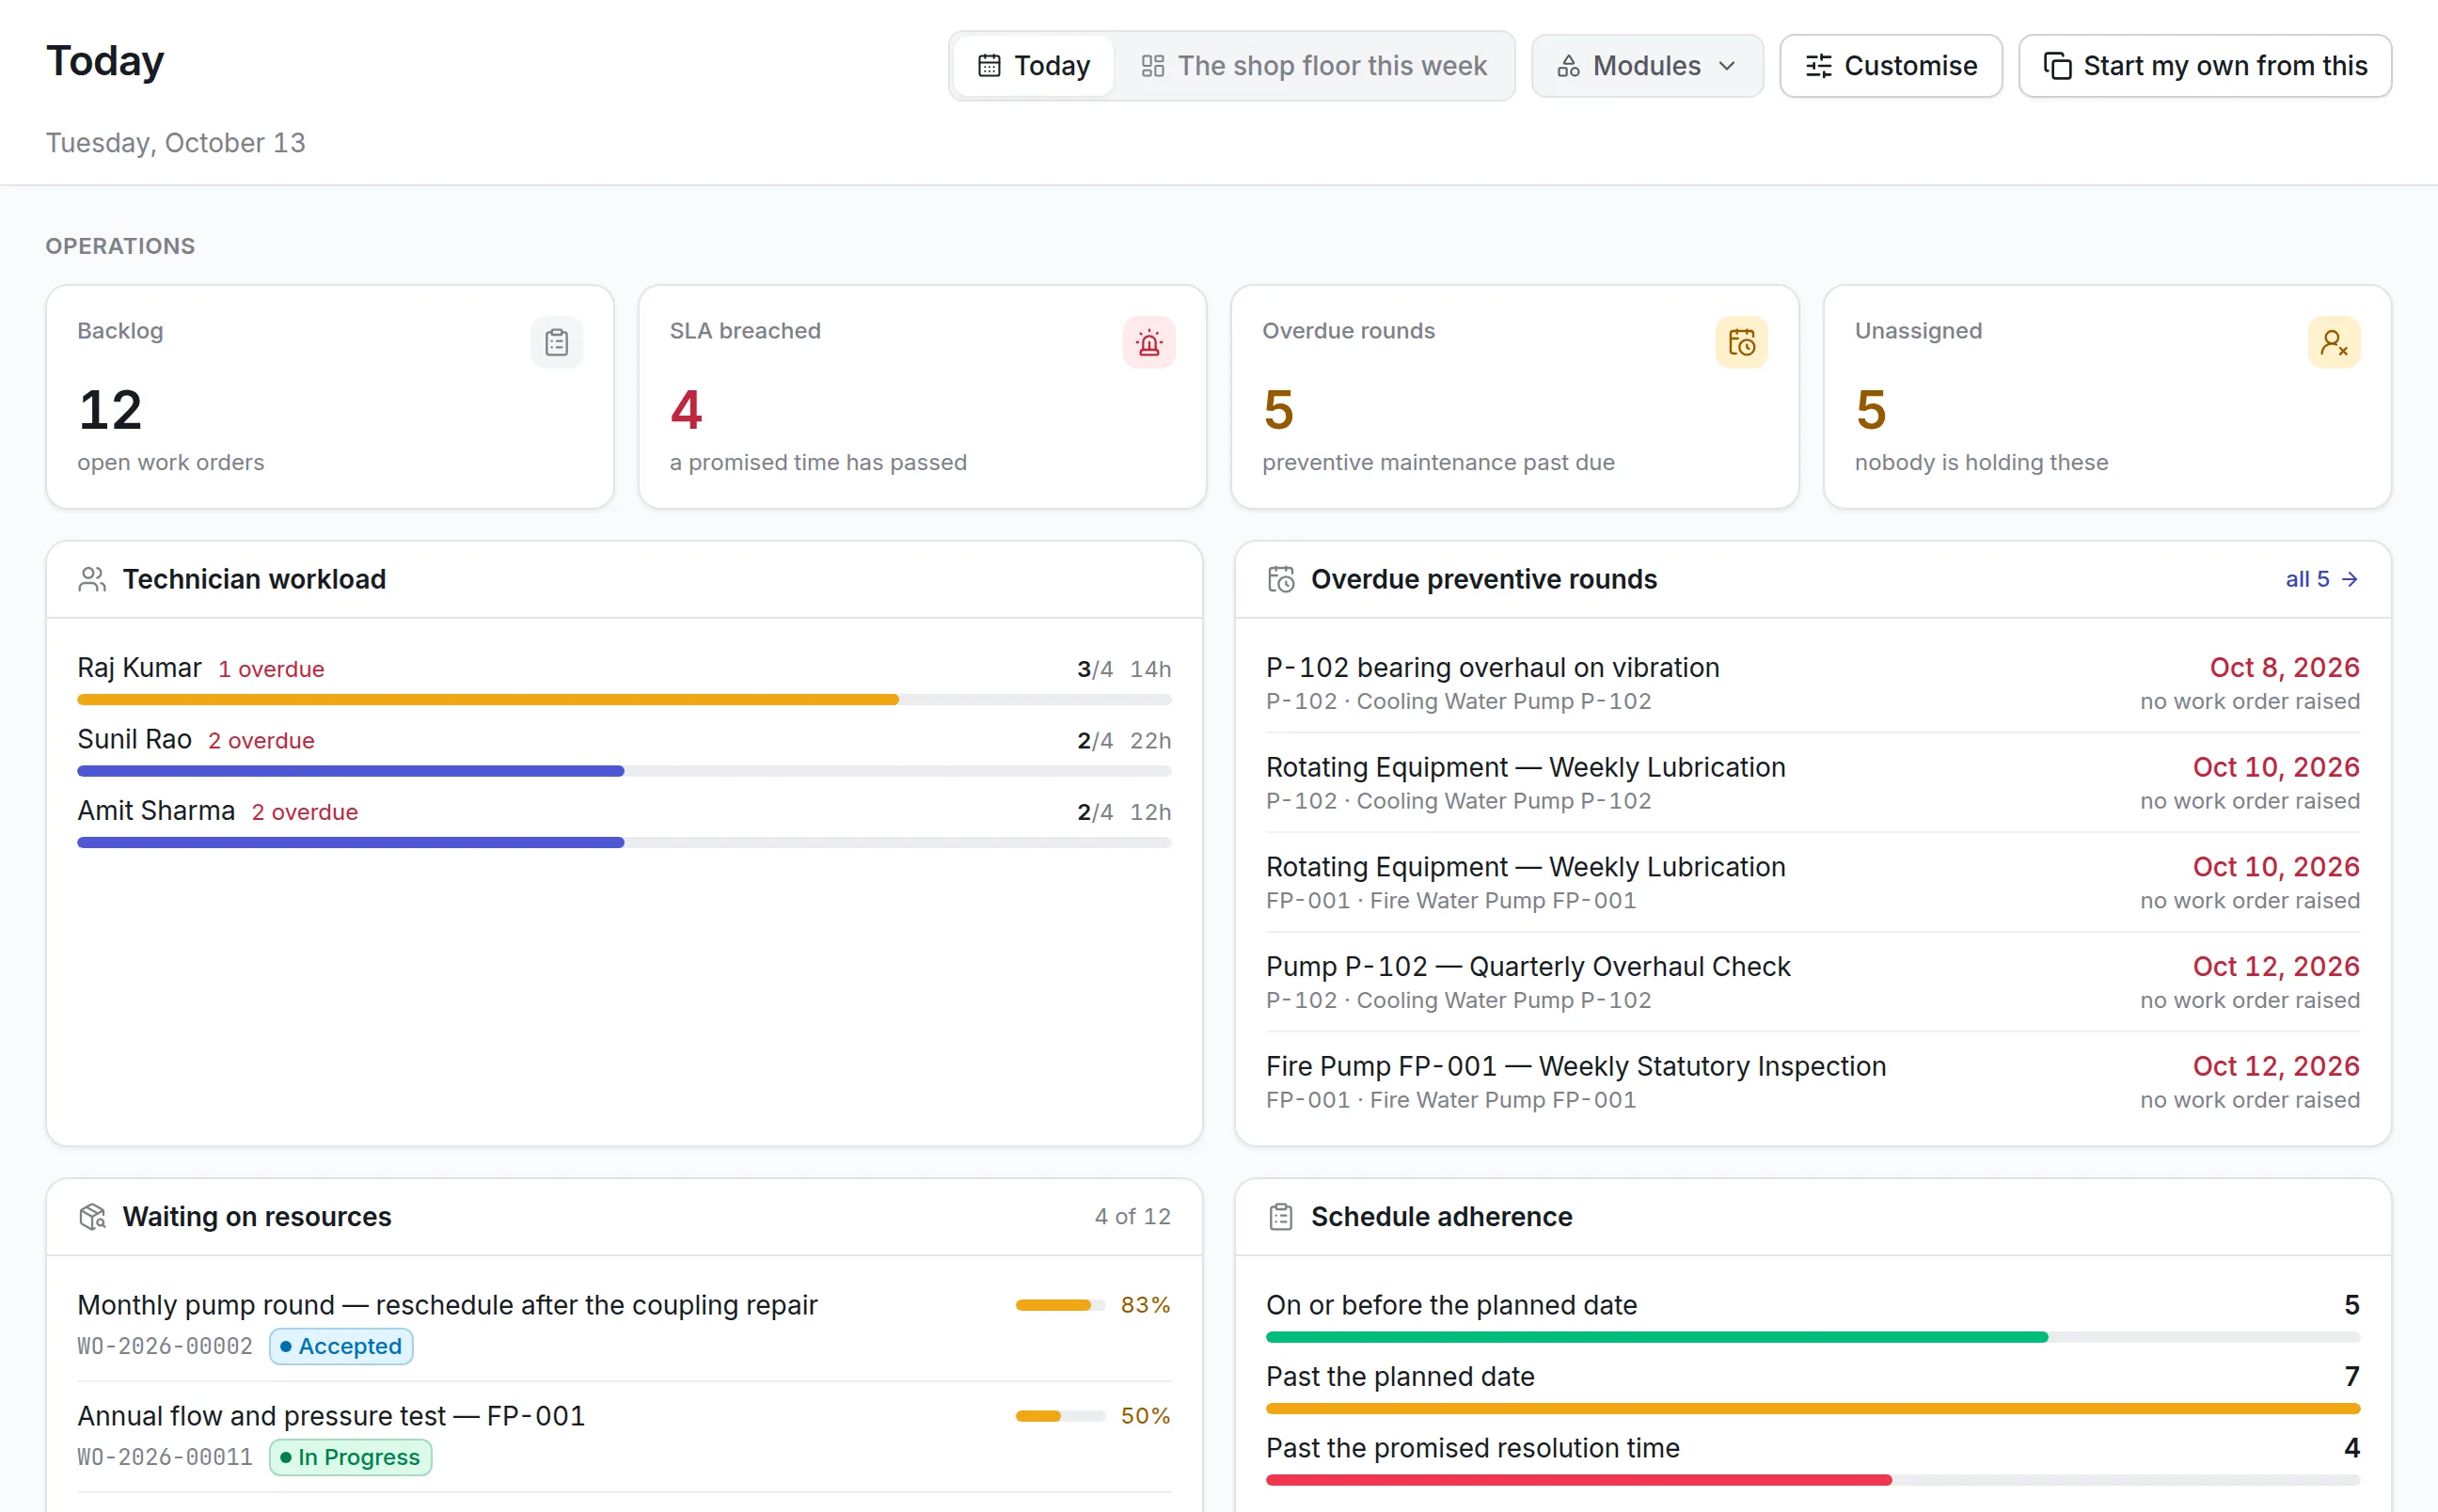
Backlog, jobs past their promised time, overdue preventive rounds, unassigned work and each technician’s workload. A click on any tile shows the jobs behind it.
Plant and reliability engineers
Availability, MTBF and MTTR over the last 3, 6 or 12 months, the bad actors that fail most, and repeat faults worth a root cause investigation.
Finance and audit
Book value by asset class, assets acquired by month, depreciation for the period, disposals by reason and the results of the latest verification round.
IT and procurement
Warranty and contract expiry, purchase spend by vendor and the number of assets checked out to each department.
Leadership
A short executive board: assets by status, maintenance cost against budget, availability and the few numbers that moved most since last month.
Customizable dashboards that people use
A fixed dashboard suits nobody for long. Customizable dashboards let each team build the view it needs without asking IT. When you evaluate them, look for these capabilities.
| Capability | Why it matters |
|---|---|
| Figures from live records | A rebuilt spreadsheet is out of date by the next day |
| Ready-made boards | Teams get value on day one before building anything |
| Widgets you choose | Numbers, charts, trends, tables and pivots for different questions |
| Drill-down to rows | A number nobody can check is not trusted |
| Site and period filters | One board serves every site and any date range |
| Thresholds and targets | Tiles turn amber or red when a figure goes past a limit |
| Sharing that respects access | Each person sees only the sites and assets they may see |
| Scheduled delivery | Managers who never open the dashboard still get the numbers by email |
| Works on a phone | Supervisors check the board on the plant floor |
Tips for an asset management dashboard that gets used
- Start from decisions. For each tile, name the decision it supports. If there is none, leave it off.
- Keep the data clean. A dashboard is only as good as the register under it, so tag assets and record moves and repairs when they happen.
- Give each role its own board. A technician, a plant manager and a CFO want different numbers.
- Set targets. A number without a target does not tell anyone whether to act.
- Send it. Schedule the weekly board to the people who need it, so it does not depend on someone remembering to look.
How Asset Infinity’s asset management dashboard works
Asset Infinity’s dashboards and reports are built in three layers, and every figure is counted with the reader’s own site access and permissions. Two people can open the same board and each sees only what they are allowed to.
- Today. The home screen assembles your own work, operations and the organization’s figures from what your role can read.
- Ready-made boards. Boards come with the product for areas such as asset finance, verification, assets, bookings, work orders, planned maintenance, reliability, inventory, purchasing and energy, plus an executive overview.
- Boards you build. Duplicate a board or start from blank, and add Number, Ranking, Proportion, Bars over time, Trend, Table, Pivot table or Note widgets. Thresholds color a tile amber or red, and site and period filters apply across the board. Share it with yourself, named people, roles or everyone.
- Reliability figures. MTBF, MTTR, availability and PM compliance are worked out nightly from closed work and asset status history, so the same number appears on every board. See root cause analysis software.
- Saved reports. A new organization starts with 78 reports. Asset reports include the asset register, asset movement history, warranty and contract expiry, disposals by reason, verification results, the depreciation register, assets acquired by month and book value by asset class. The asset register and fixed asset management software pages cover where those figures come from.
- Scheduled delivery. Reports go out daily, weekly or monthly as CSV, Excel or PDF, and boards as PDF or Excel, with a log of what was sent.
Maintenance figures come from the same preventive maintenance software and work orders your technicians already use. The asset register starts at $130 a month for up to 500 assets with unlimited users, and Analytics, which covers reports and the dashboard builder, is $10 per user per month. Build a quote for your team.
Frequently Asked Questions
What should an asset management dashboard include?
Start with assets by status, overdue maintenance, maintenance backlog, downtime, maintenance cost and book value. Add utilization, MTBF, MTTR and warranty expiry as your data matures.
What is the difference between an asset report and a dashboard?
A dashboard summarizes the current state in tiles and charts so you can spot what needs attention. A report lists the full detail behind a question, such as every asset with an expiring warranty.
What is an asset summary report?
An asset summary report gives an overview of assets by type, location, condition and value, often with totals by category and site. It is the starting point for audits and insurance reviews.
Can different people see different numbers on the same dashboard?
In Asset Infinity, yes. Every figure is counted with the reader’s own access, so a site manager sees their sites and a regional director sees all of theirs on the same board.